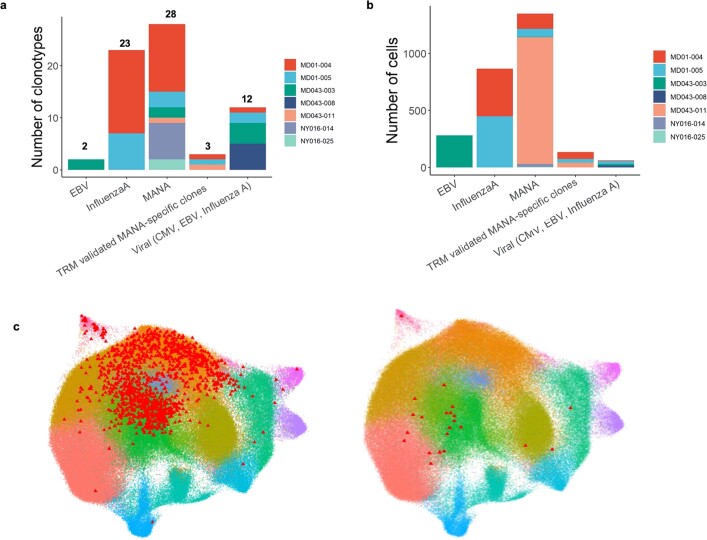
Extended Data Fig. 9. Patient representation of antigen-specific clonotypes.
a, b, Barplots summarize the total number of unique tumour-infiltrating clonotypes (a) and cells (b), stratified by antigen specificity and method of detection (MANAFEST or based on the TRM gene signature and cloning/peptide screen). Different colours represent the patient identity. c, Visualization of clonotypes included in the MANA-specific analysis. The individual UMAP projections of clonotypes that were validated (left) and were not validated (right) by TCR cloning are shown. Of the cells that corresponded to a MANAFEST-identified, MANA-specific clonotype that was detected in the single-cell data, >94% were validated by the jurkat/luciferase TCR cloning system.

