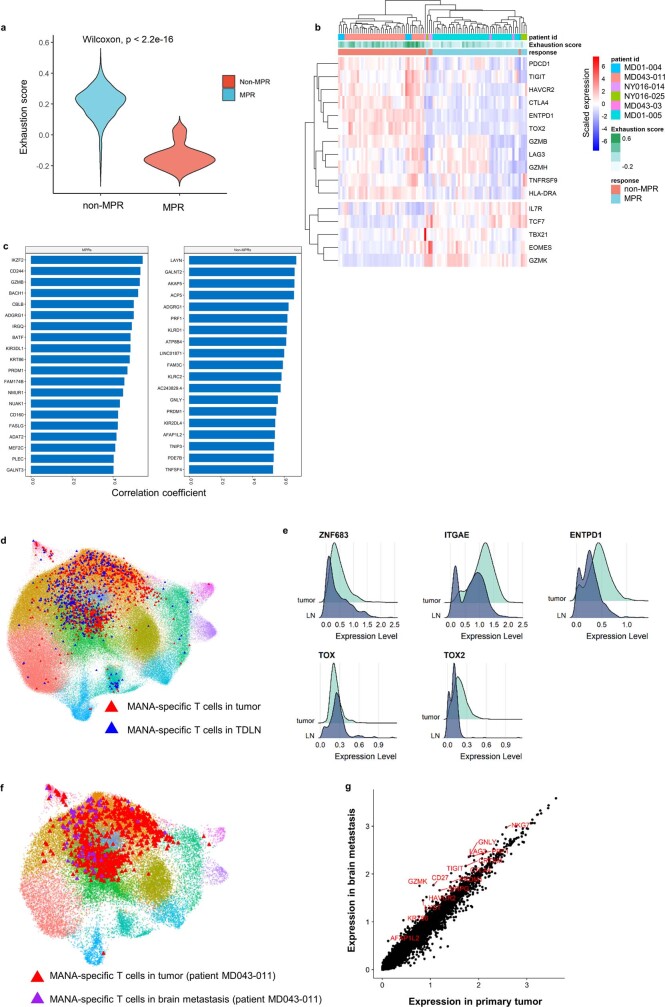
Extended Data Fig. 10. Signatures of MANA-specific T cells according to response and tissue compartment.
a, Exhaustion score and co-expression of immune checkpoints/effector/memory function gene on MANA-specific TIL. Violin plot shows the exhaustion gene-set score (Supplementary Data 2.2) of MANA-specific TIL of non-MPR (red, n = 3) and MPR (light blue, n = 3) tumours. Comparisons were performed at the individual cell level using two-sided Wilcoxon rank sum test without multiple comparison adjustment. b, Heat map shows co-expression of immune checkpoints and effector/memory genes on MANA-specific TIL. Each column represent a cell. The exhaustion score, response status, and patient IDs are designated by the relevant colour bar. For visualization, MANA-specific T cells were downsampled to the same number of cells from MPR (n = 3) and non-MPR (n = 3). c, Top ranked genes correlated with the immune checkpoint score in MANA-specific TIL. Barplots show the correlation coefficients of the top ranked genes highly correlated with the immune checkpoint score in MPR (left) and non-MPR (right) MANA-specific TIL. d, MANA-specific T cells found in the tumour (red triangles) and TDLN (blue triangles) of patients MD01-004, MD01-005, and MD043-011 were projected on the refined CD8 UMAP. e, Expression of selective genes is shown for MANA-specific T cells in the tumour and TDLN (n = 3). f, MANA-specific T cells found in the tumour (red triangle) and brain metastasis (purple triangle) are shown on the UMAP for patient MD043-011. g, The scatterplot shows the average expression of genes comparing all refined CD8 T cells from the primary tumour and metastatic brain resection in patient MD043-011. The top differential genes enriched in the brain metastasis are labelled in red. Comparisons were performed at the individual cell level using two-sided Wilcoxon rank sum test. P-value adjustment was performed using bonferroni correction. A complete list of differential genes comparing primary tumour at resection vs. the distant brain metastasis is shown in Supplementary Data 1.5. CD8 T cell clusters are marked by the same colour code as Fig. 2b.

