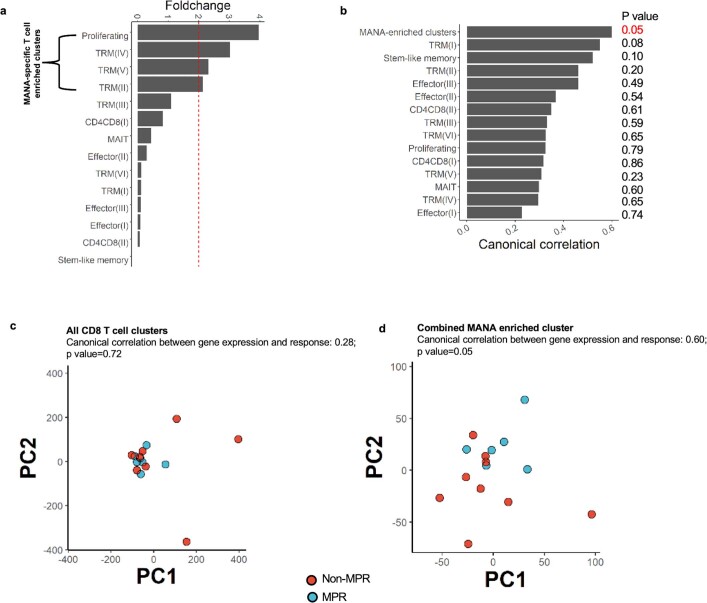
Extended Data Fig. 11. Canonical correlations of CD8 T cell clusters with pathologic response.
The canonical correlation between pathologic response status and CD8 T cell clusters vs. a MANA-specific T cell-enriched cluster was evaluated. a, Selection of MANA-specific T cell enriched clusters (Proliferating, TRM(IV), TRM (V) and TRM (II)) based on >2 fold change (red dotted line) of MANA-specific T cell frequency relative to random expectation. The above 4 clusters were combined as a ‘MANA-combined’ cluster. b, Combined MANA-specific T cell enriched clusters showed the highest canonical correlation with pathologic response. c, PCA of pseudobulk gene expression from all CD8 T cell clusters for individual tumour samples (n = 15, 6 MPRs and 9 non-MPRs), coloured by response status (MPR as blue blue dots, non-MPR as red dots). d, PCA of pseudobulk gene expression from combined MANA enriched T cell cluster for individual tumour samples (n = 15, 6 MPRs and 9 non-MPRs), coloured by response status (MPR as light blue dots, non-MPR as red dots). P values were obtained using a one-sided permutation test, without correction for multiple comparisons.

