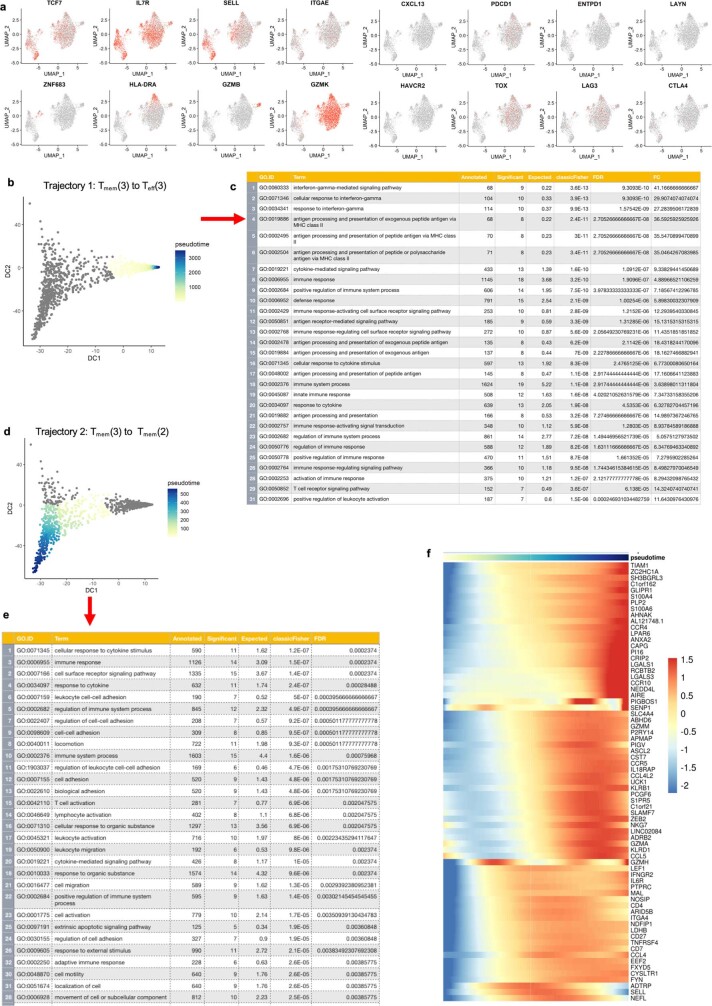
Extended Data Fig. 12. Phenotypic characteristics of FACS-sorted peripheral blood CD8+/Vβ2+ T cells from MPR MD01-005.
a, Selective gene expression of 2D UMAP red-scale projection is shown of canonical T cell subset marker genes, cell subset selective genes, and immune checkpoints on CD8 T cell subsets sorted from longitudinal peripheral blood of one patient (MD01-005) with complete pathologic response. b-d, Pseudotime reconstruction and pseudo-temporal dynamic gene identification in peripheral blood CD8 T cells from a complete pathologic responder. Longitudinal PBMC were collected from complete pathologic responder MD01-005 (0% residual tumour) during treatment and in post-surgery follow up. Peripheral blood CD8+ T cells were FACS sorted based on expression of TCR Vβ2, which corresponds to the MANA-specific CDR3 CASNKLGYQPQHF as identified previously via the MANAFEST assay (Extended Data Fig. 2a). scRNA-seq–TCR-seq was performed on the sorted population from each time point. b, Constructing the pseudotime axis on the diffusion map from Tmem(3) to Teff(3) as trajectory 1. c, GO analysis for genes that significantly change along trajectory 1, ranked by FDR. d, Constructing the pseudotime axis on the diffusion map from Tmem(3) to Tmem(2) as trajectory 2. e, GO analysis for genes that significantly change along trajectory 2, ranked by FDR. f, Heat map showing genes that significantly change along trajectory 2 (FDR < 0.05).

