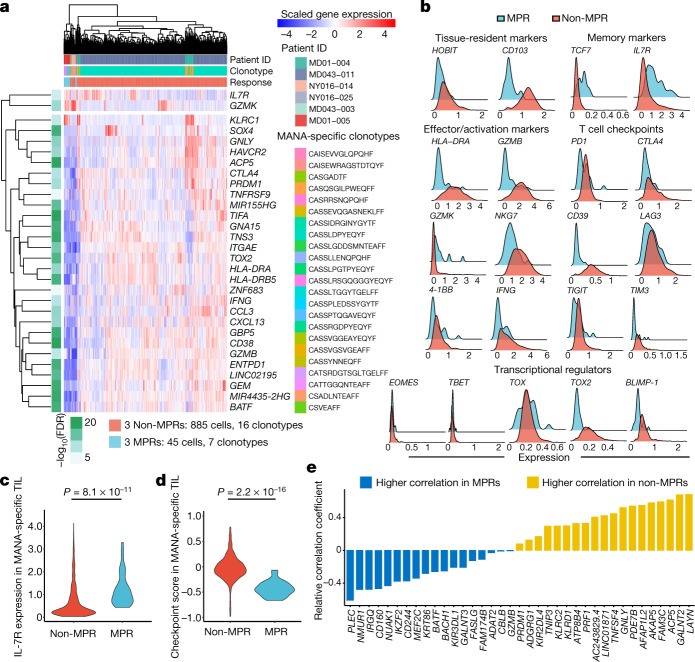
Fig. 3. Differential gene expression programs of MANA-specific CD8 T cells in MPR versus non-MPR tumours.
Seven unique MANA-specific clonotypes, representing 45 total transcriptomes, were identified in MPR TIL: 39 from MD01-005, 2 from MD043-003 and 4 from NY016-025. In non-MPR TIL, 16 unique clonotypes, representing 885 total transcriptomes, were identified: 782 from MD043-011, 62 from MD01-004 and 22 from NY016-014 (Supplementary Table 8). Differential gene expression analysis was performed on the MANA-specific T cells detected in MPR (n = 3) and non-MPR (n = 3) tumours. a, The top differential genes and selective immune markers of tumour-infiltrating MANA-specific T cells from MPR and non-MPR tumours. Comparisons were performed at the individual cell level using two-sided Wilcoxon rank sum test. P-value adjustment was performed using Bonferroni correction. Side bar shows the adjusted P value (green scale) and response status (red, TIL from MPR; light blue, TIL from non-MPR). b, Histograms show the expression of key genes among MANA-specific T cells from MPR (light blue) and non-MPR (red) tumours. c, A violin plot shows IL-7R expression by each MANA-specific CD8 T cell in MPR (red) and non-MPR (light blue) tumours. Comparisons were performed at the individual cell level using two-sided Wilcoxon rank-sum test. d, A T cell immune checkpoint score was calculated for each MANA-specific CD8 T cell detected in MPR (red) and non-MPR (light blue) tumours. This checkpoint score was compared between MPR and non-MPR using two-sided Wilcoxon rank-sum test. e, The relative correlation coefficient (MPR MANA-specific TIL versus non-MPR MANA-specific TIL) with the immune checkpoint score is shown for genes more highly correlated in non-MPR (yellow) and MPR (blue) TIL.

