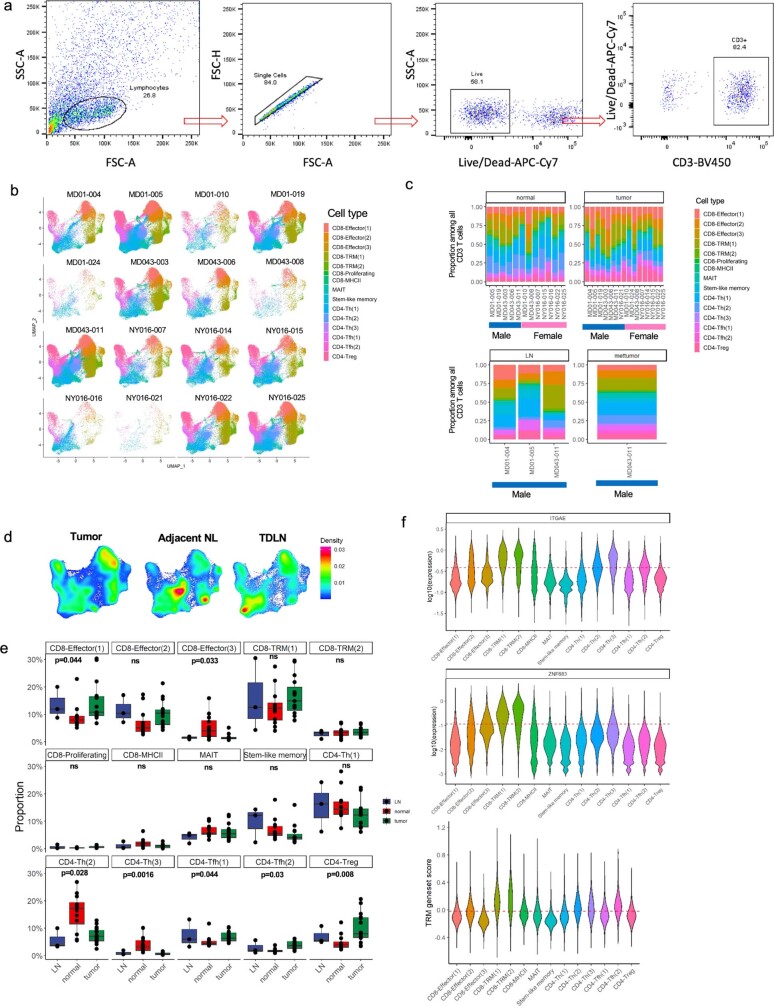
Extended Data Fig. 1. Defining CD3+ T cell subsets in patients with non-small cell cancer treated with anti-PD-1.
a, FACS gating strategy for sorting CD3+ T cells. The gating strategy is shown for sorting live CD3+ T cells from tumour, normal lung, lymph node, or metastasis, when available, on a BD FACSAria. b, Patient and tissue compartment variability across clusters on UMAP. scRNA-seq–TCR-seq was performed on available resected biospecimens (tumour, adjacent NL, TDLN, and a brain metastasis) from 16 patients treated with neoadjuvant PD-1 blockade. CD3+ T cells stratified by patient are visualized using UMAP. Each cluster is annotated and marked by colour code. c, Barplots show the proportion of each T cell cluster in the TDLN, brain metastasis, tumour, and adjacent NL of each patient. Each cluster as shown on the UMAP is denoted by colour code. No clusters were driven by a particular patient based. d, A density plot of all CD3+ T cells on the UMAP, stratified by tissue compartment, is shown. Cells were obtained from 15 tumours, 12 adjacent NL specimens, and 3 TDLN. Because a metastasis was sequenced in only one patient, this specimen is not included in this analysis. e, The proportion (%) of total CD3+ T cells made up by each T cell cluster was compared between tumour (n = 15 biologically independent samples), adjacent NL (n = 12 biologically independent samples), and TDLN (n = 3 biologically independent samples). P values were obtained using Kruskal–Wallis Test and were adjusted for multiple comparisons using Benjamini-Hochberg method. Each dot represents a patient and all data points are shown. Individual data points are superimposed over a Box and Whiskers plot summarizing the data. The middle bar shows the median, with the lower and upper hinges corresponding to the 25th and 75th percentiles, respectively (interquartile range, IQR). The upper whisker extends from the hinge to the largest value no further than 1.5 * IQR from the hinge. The lower whisker extends from the hinge to the smallest value at most 1.5 * IQR of the hinge. f, Tissue-resident defining genes and core TRM gene set signature on different T cell cluster. The top and middle violin plots show the expression of TRM-defining genes (ITGAE, ZNF683) by each cell in each cluster. The dashed line indicates the mean expression of the respective gene among all CD3+ T cells. Expression values were log10 transformed for visualization. The bottom violin plot shows the TRM gene-set score for each cluster. This gene-set is comprised of TRM-associated genes as published previously (Supplementary Data 2.1). The dashed line shows the mean TRM gene-set score among all T cells. Because the proliferating cluster is driven by proliferation-associated genes and is comprised of mixed cell types, this cluster was not shown in the violin plots.

