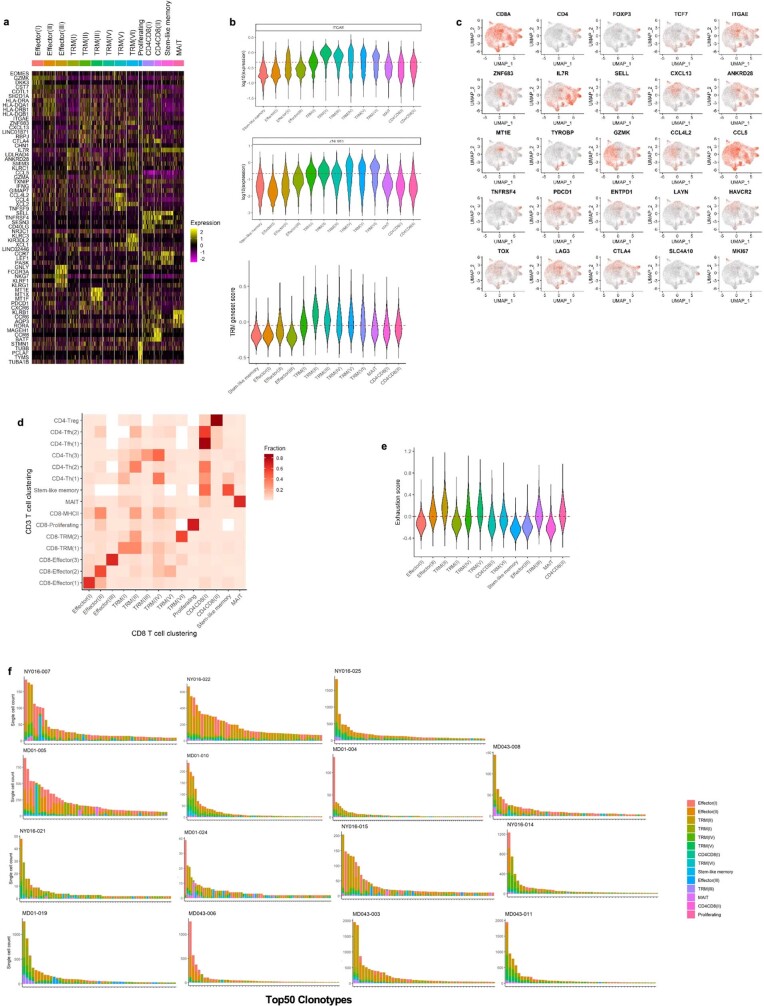
Extended Data Fig. 5. Refined clustering on CD8 T cells.
a, A heat map shows the top differential genes, ranked by average fold change, for each refined CD8 T cell cluster. 5,000 cells (or all cells in the cluster if cluster size <5000 cells) were randomly sampled from each cluster for visualization (n = 16 patients). b, Violin plots show the log10 expression of the TRM-defining genes, ITGAE (top) and ZNF683 (HOBIT, middle), and a TRM gene-set score (bottom) for each CD8 T cell cluster. The dashed line indicates the mean expression of the respective gene or gene-set score among all CD8 T cells. Because the proliferating cluster is driven by proliferation-associated genes and represents mixed cell types, this cluster was not shown in the plot. c, 2D UMAP red-scale projection of canonical T cell subset marker genes, cell subset selective genes, and immune checkpoints on CD8 T cell subsets. d, A heat map shows the proportion of each refined CD8 T cell cluster (Fig. 2b) that is found within each global UMAP T cell cluster (Fig. 1b). This enables visualization of the “parent” cluster for the refined CD8 T cell clusters. e, A violin plot shows the exhaustion gene-set score, comprised of a published exhaustion gene list (Supplementary Data 2.2), for each refined CD8 T cell cluster. The dashed line shows the mean exhaustion gene-set score among all CD8 T cells. Because the proliferating cluster is driven by proliferation-associated genes and represents mixed cell types, this cluster was not shown in the plot. f, CD8+ T cell clonotypic cluster composition. The top 50 CD8+ TCR clonotypes in the tumour are shown for each patient, and the proportion of each clonotype that was found within each cluster is designated by the colour code.

