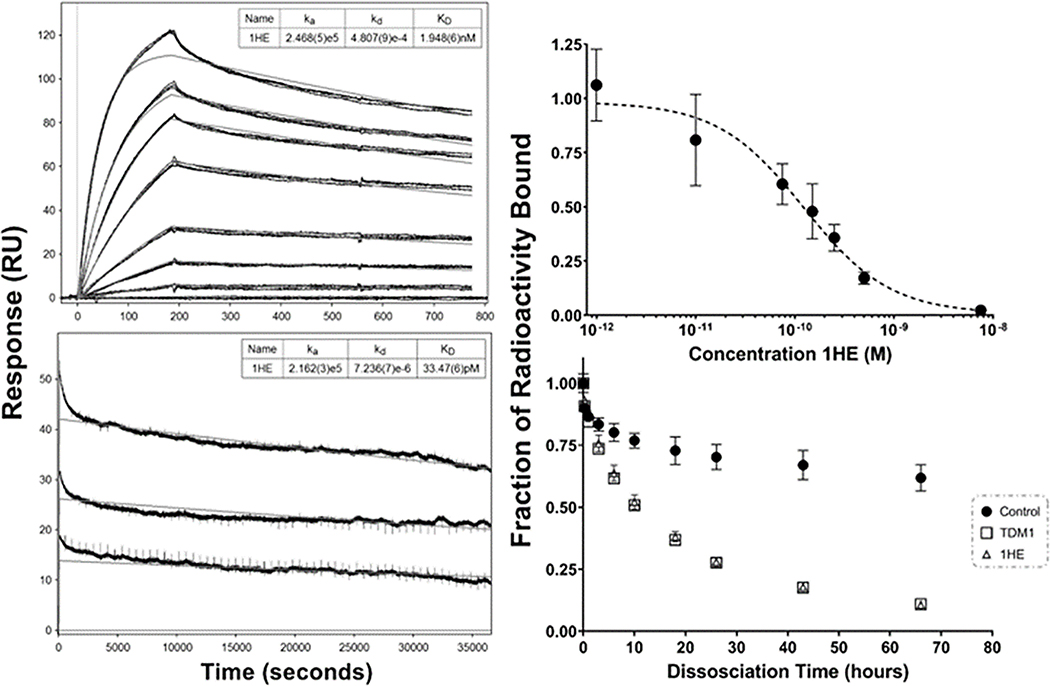
Figure 2: 1HE-trastuzumab binding characterization.
The initial SPR evaluation of 1HE-trastuzumab binding with a ten-minute dissociation is shown in the top left panel. A second SPR run with a 10-hour dissociation time frame is shown in the bottom left panel. Model fits for the association rate constant (ka), dissociation rate constant (kd), and equilibrium dissociation rate constant (KD) are shown in the top right for each sensorgram with standard deviation for each parameter provided in brackets. Similar association rate constants were observed between runs while the best fit dissociation rate constant was 4.8×10⁻⁴ sec−1 for the 10-minute dissociation and 7.2×10⁻⁶ sec−1 for the 10-hour dissociation. Shown in the top right panel is the competitive cell inhibition assay to assess the impact of 1HE on trastuzumab-HER2 binding, shown is the ratio of 125I-trastuzumab bound to SKOV3 cells (as measured by cell-associated radioactivity) when incubated with 1HE in comparison to a 125I-trastuzumab only control. 1HE inhibited trastuzumab-HER2 binding with an IC50 of 124 pM. The dissociation of 125I-1HE from trastuzumab immobilized magnetic beads is shown in the bottom right panel. 125I-1HE bound beads were incubated with a 0.1% BSA-PBS control or with 1 μM ado-trastuzumab emtansine (T-DM1), or 1 μM cold-1HE in 0.1% BSA-PBS to prevent rebinding. At the indicated time-points, the supernatant was removed, fresh buffer-solution added, and bound radioactivity assessed. The addition of cold-1HE or free trastuzumab emtansine (T-DM1) led to overlaying dissociation curves, whereas the dissociation rate in blank buffer was significantly slower due to 125I-1HE rebinding trastuzumab-beads. Individual points represent the mean of triplicate samples with standard deviation error bars.

