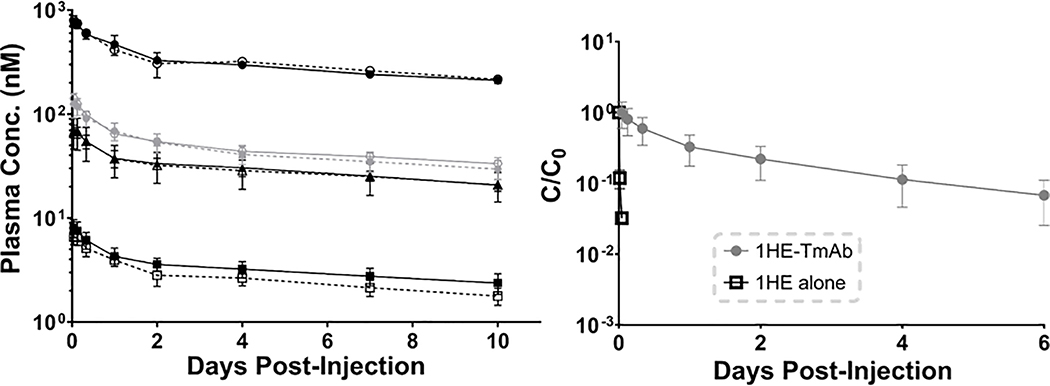
Figure 3: Trastuzumab plasma pharmacokinetics with and without 1HE co-administration.
(Left) Plasma time profiles for trastuzumab (black) or T-DM1 (gray) administered alone (closed symbols) or in combination with 1HE (open symbols) at a dose of 10 mg/kg (circles), 1.8 mg/kg (diamonds), 1 mg/kg (triangles), and 0.1 mg/kg (squares). (Right) Plasma time profiles for 1HE administered at a 1 mg/kg dose alone (black open squares) or 1HE administered with 1 mg/kg trastuzumab (gray circles) is shown. 1HE administered alone is rapidly eliminated, consistent with expectations for a ~15 kDa protein, while 1HE co-administered with trastuzumab has an increased plasma half-life.

