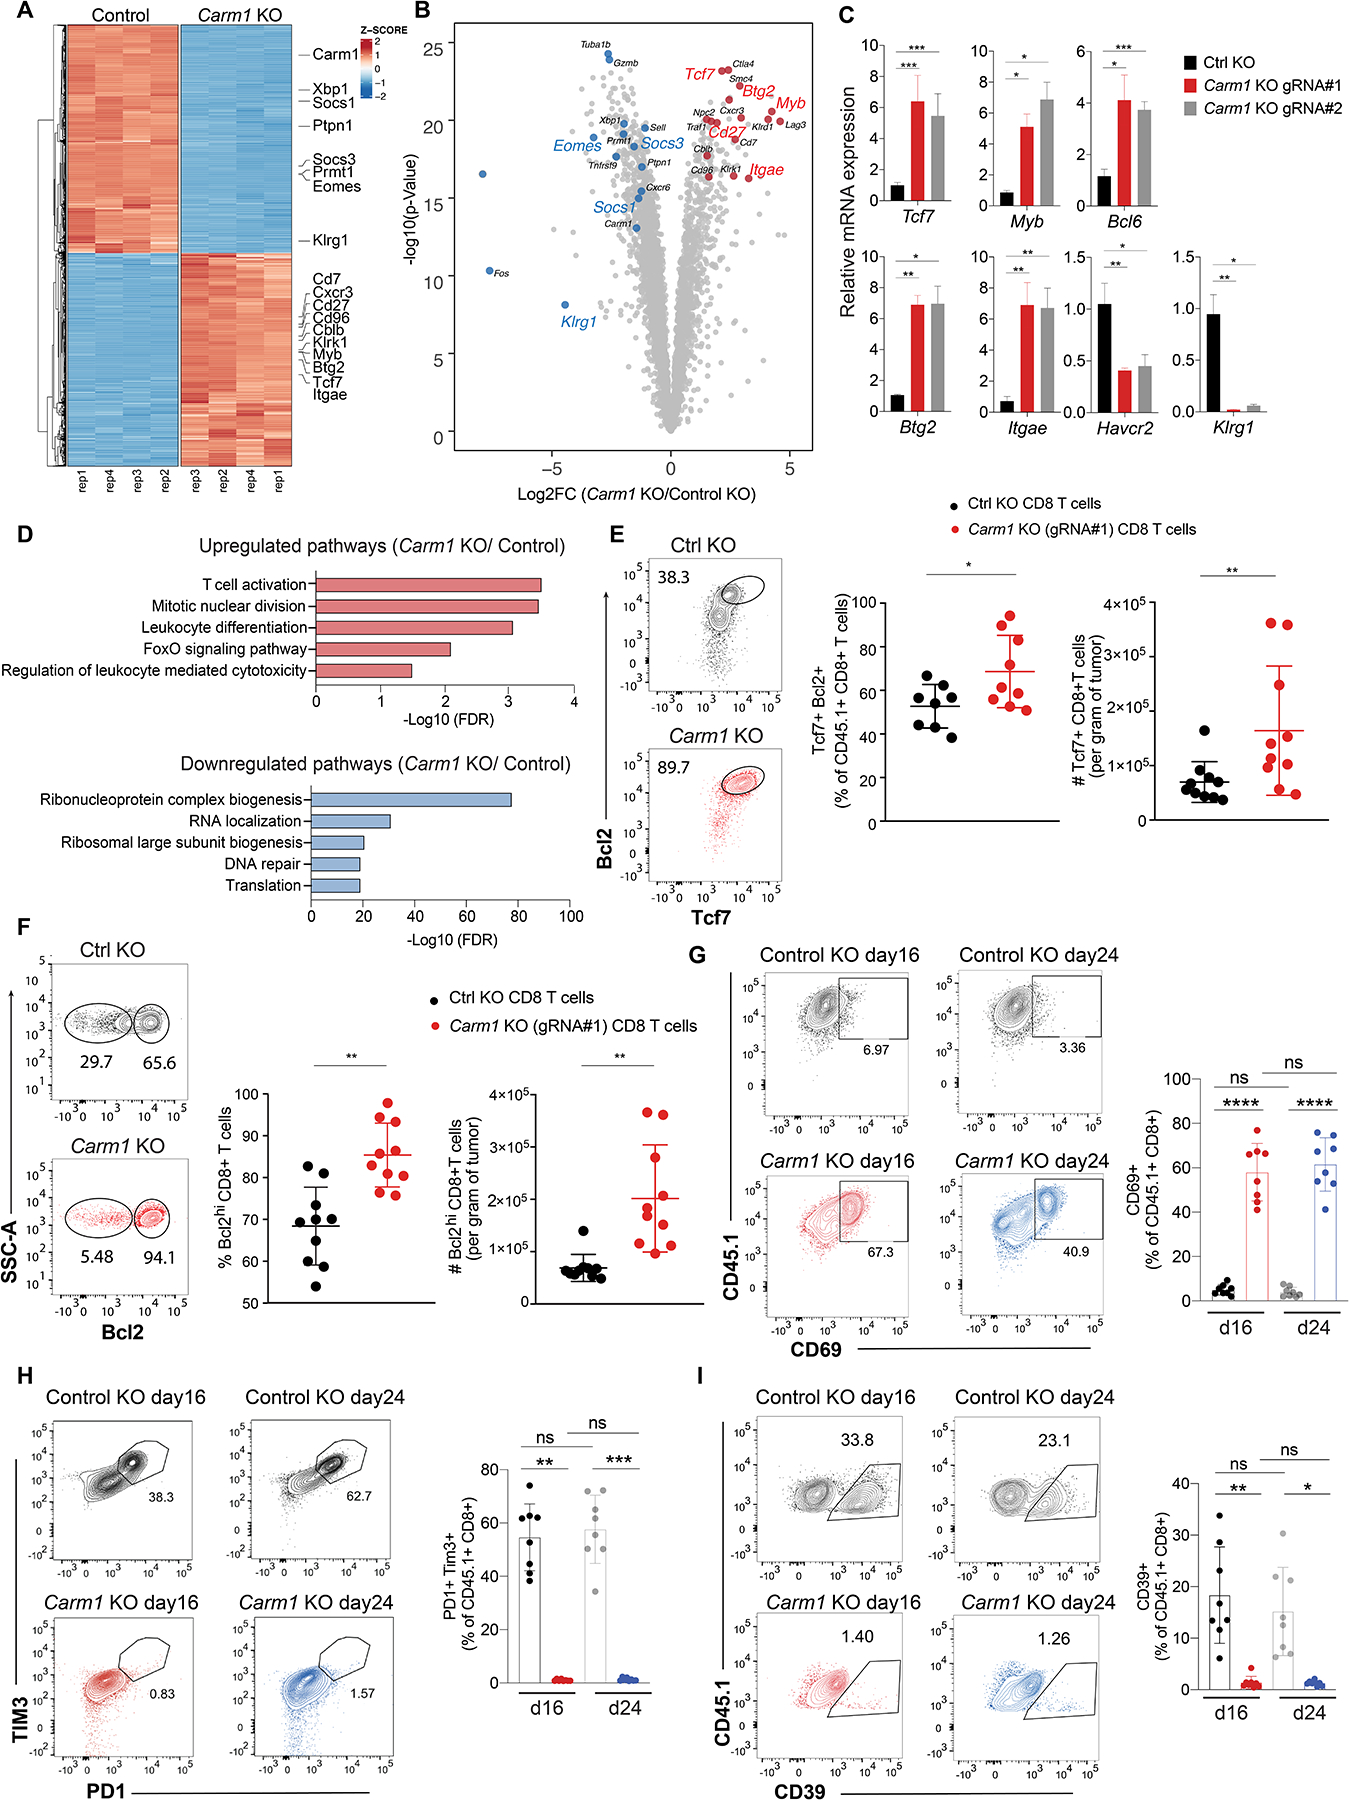
Figure 2. Carm1 inhibition in CD8 T cells enhances their anti-tumor function.

A. NA-seq analysis of differentially expressed genes in Carm1-KO or control-KO OT-I CD8 T cells co-cultured for 24 hours with B16F10-Ova tumor cells (four biological replicates per condition). Color code represents Z-scores for differential gene expression.
B. Volcano plot of all differentially expressed genes between Carm1-KO and control-KO OT-I CD8 T cells. Statistical significance (log10 adjusted P value) was plotted against log2 fold change of gene expression levels (Carm1-KO/control-KO cells).
C. RT-qPCR analysis of Tcf7, Myb, Bcl6, Btg2, Itgae, Havcr2 and Klrg1 mRNA levels in Carm1-KO and control-KO CD8 T cells (targeting of Carm1 with two different gRNAs, triplicate measurements).
D. Gene Ontology (GO) analysis of significantly upregulated/downregulated pathways in Carm1-KO versus control-KO T cells.
E. Tumor-infiltrating Carm1-KO or control-KO CD8 T cells following adoptive transfer of edited OT-I CD45.1 CD8 T cells (n=10 mice/group) with gating on CD45.1 and CD8 T cell markers. Quantification of Tcf7+ T cells with high Bcl2 protein levels and Tcf7+ CD8 T cells.
F. Quantification of Bcl2 high tumor-infiltrating Carm1-KO or control-KO CD8 T cells.
G-I. Tumor-infiltrating Carm1-KO or control-KO CD8 T cells were analyzed 16 or 24 days following adoptive transfer of edited OT-I CD45.1 CD8 T cells (n=8 mice/group) with gating on CD45.1 and CD8 T cell markers. Quantification of CD8 T activation marker (CD69) (G) and markers of T cell exhaustion (H-I).
Data shown are representative of two experiments. Two-way ANOVA was used to determine statistical significance for time points when all mice were viable for tumor measurement. Graphs shown represent data summarized as mean ± S.D. and were analyzed by unpaired two-sided Mann-Whitney test, ****P < 0.0001; ***P < 0.001; **P < 0.01; *P < 0.05.
