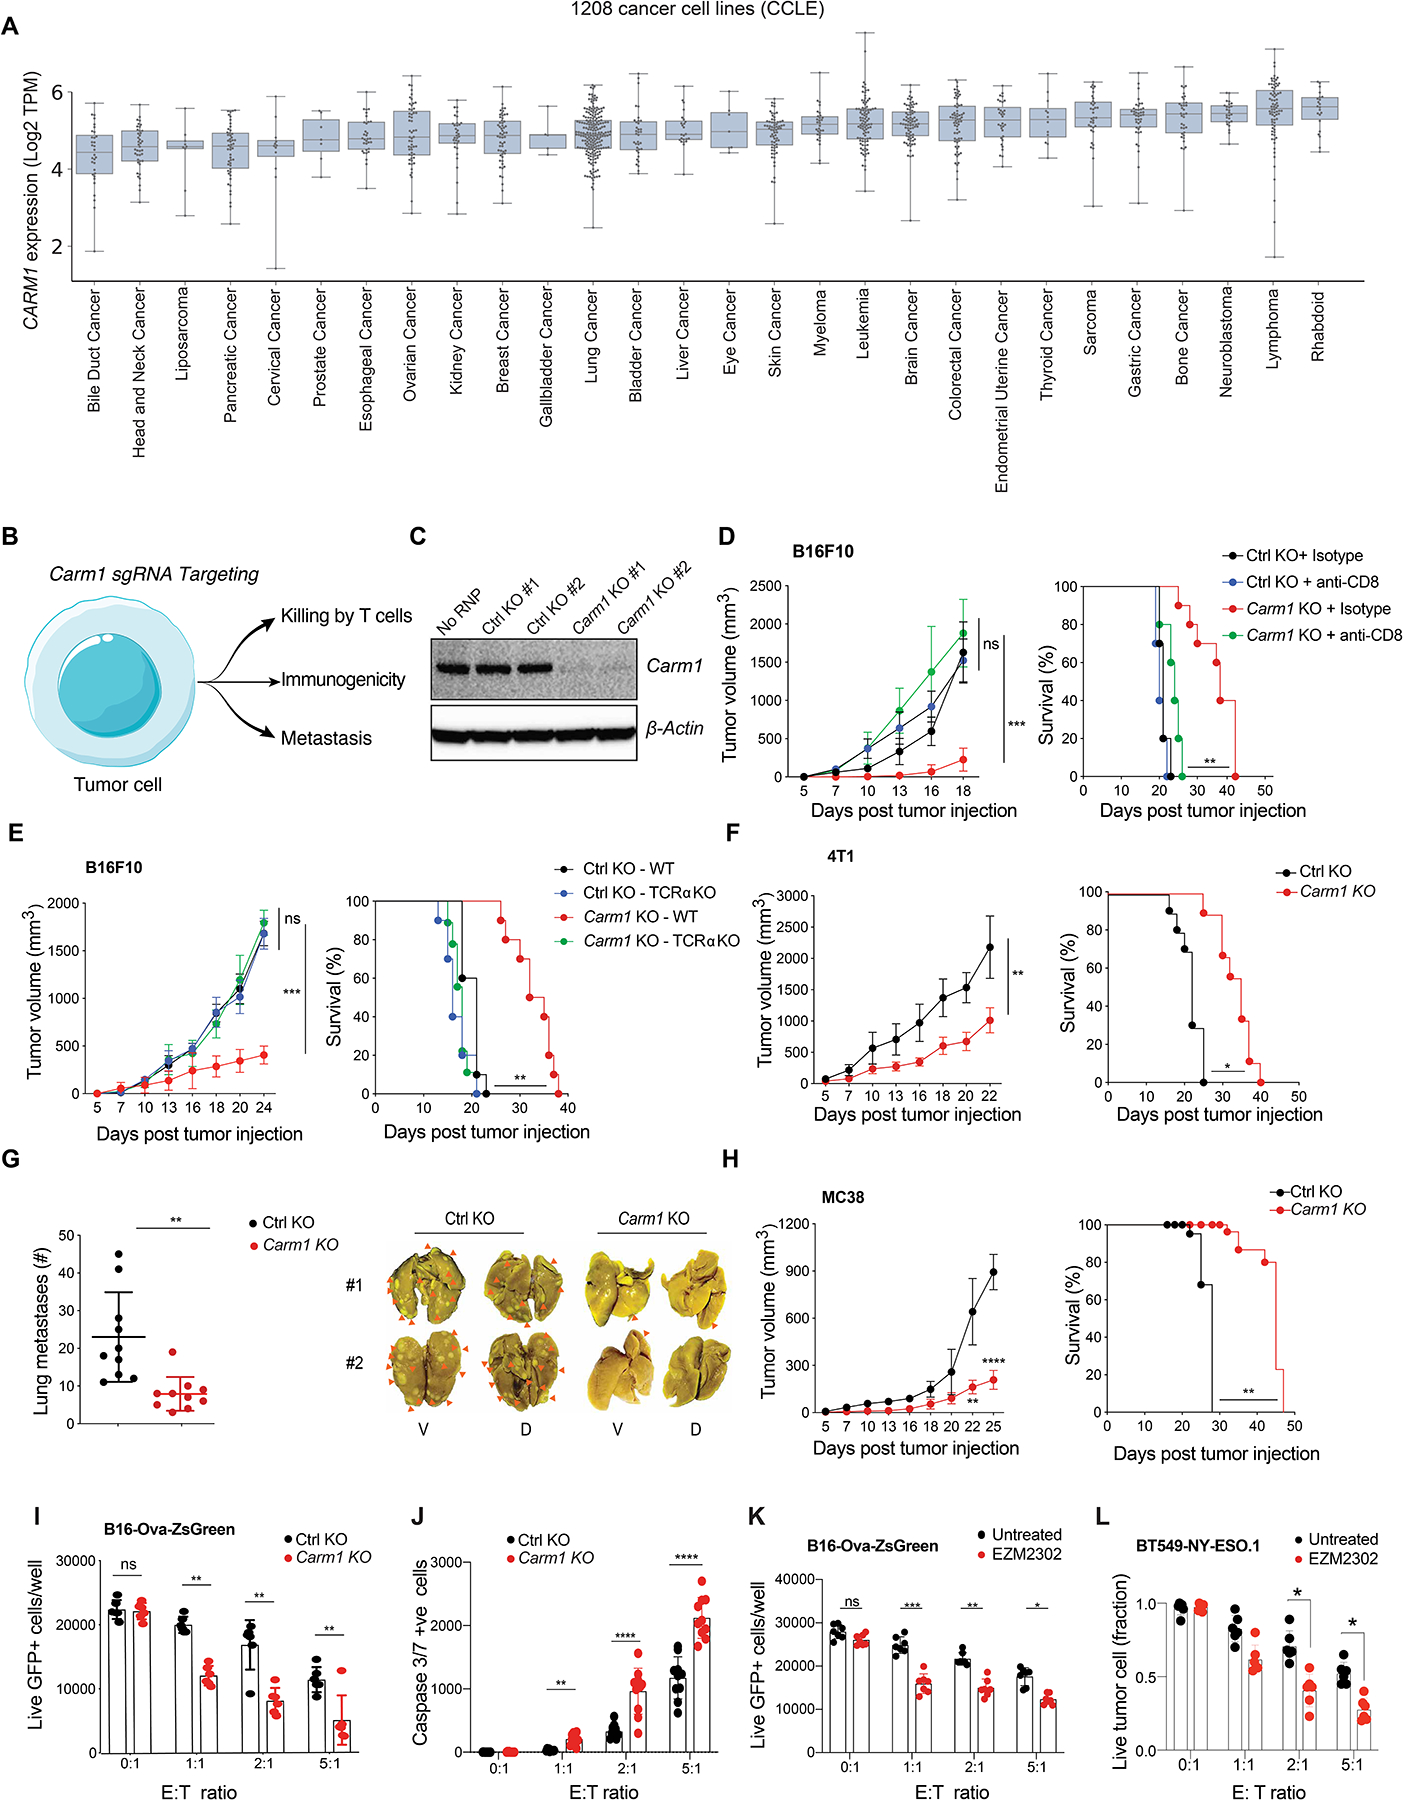
Figure 3. Inactivation of Carm1 gene in tumor cells elicits tumor immunity.

A. CARM1 mRNA levels in a diverse panel of 1,208 cancer cell lines from the Cancer Cell Line Encyclopedia (CCLE). Tumor cell lines were grouped based on cancer type.
B. Strategy for targeting Carm1 in tumor cells to study impact on T cell-mediated tumor immunity.
C. Western blot analysis of Carm1 protein in B16F10 melanoma cells following electroporation with RNPs composed of Cas9 protein and bound gRNAs (control, Carm1); two different control and Carm1 gRNAs were evaluated.
D. Growth of Carm1-KO and control-KO B16F10 tumors (left) and survival of tumor bearing mice (right). Mice (n=8–10/group) were treated with CD8 depleting or isotype control antibodies. This in vivo phenotype was confirmed with a second Carm1 gRNA (Fig. S3A).
E. Growth of Carm1-KO tumors in T cell-deficient mice. Carm1-KO and control-KO B16F10 tumor cells (0.2×10⁶) were implanted into immunocompetent or immunodeficient (Tcra KO) mice (n=8–10 mice/group); tumor growth (left) and survival (right) were recorded.
F. Growth of Carm1-KO or control-KO 4T1 tumor cells following implantation into the mammary fat pad (n=8–10 mice/group); tumor growth (left) and survival (right) were recorded
G. Quantification of spontaneous lung metastases formed by Carm1-KO or control-KO 4T1 tumors in immunocompetent mice. Representative images of lung metastases (V, ventral; D, dorsal) (right).
H. Tumor growth (left) and survival (right) following implantation of Carm1-KO and control-KO MC38 tumor cells (n=8–10 mice/group).
I. T cell cytotoxicity assay with Carm1-KO or control-KO B16F10-OVA-ZsGreen tumor cells. Tumor cells were co-cultured for 24 hours with OT-I CD8 T cells at indicated effector to target (E:T) ratios (n=8–10 replicates per condition).
J. Induction of tumor cell apoptosis (Carm1-KO or control-KO B16F10-OVA-ZsGreen cells) by CD8 T cells (as described in I), measured with a Caspase-3/7 dye at different E:T ratios (n = 8–10 replicates /group).
K. Sensitization of tumor cells to T cells with a CARM1 inhibitor. B16F10-OVA-ZsGreen tumor cells were pretreated with CARM1 inhibitor (EZM2302, 0.1μM) for 24 hours. Vehicle or inhibitor treated tumor cells were co-cultured with OT-I CD8 T cells at indicated E:T ratios (n=7–8 replicates/condition).
L. T cell cytotoxicity assay with human BT549 TNBC and human CD8 T cells that expressed a NY-ESO-1 TCR. Tumor cells were pretreated with CARM1 inhibitor (EZM2302, 0.1μM) for 24 hours (n=7–10 replicates/group); numbers of surviving tumor cells were quantified after 24 hours of co-culture.
Two-way ANOVA was used to determine statistical significance for tumor measurements at time points when all mice were alive. Statistical significance for survival of mice in each treatment group were calculated by Log-rank (Mantel-Cox) test. Bar graphs represent data summarized as mean ± S.E.M. and were analyzed by unpaired two-sided Mann-Whitney test. Data shown are representative of three experiments. *p < 0.05, **p < 0.01, ***p < 0.001, ****p < 0.0001, ns (non-significant).
