
Figure 5. Carm1 inhibition overcomes resistance to checkpoint blockade.
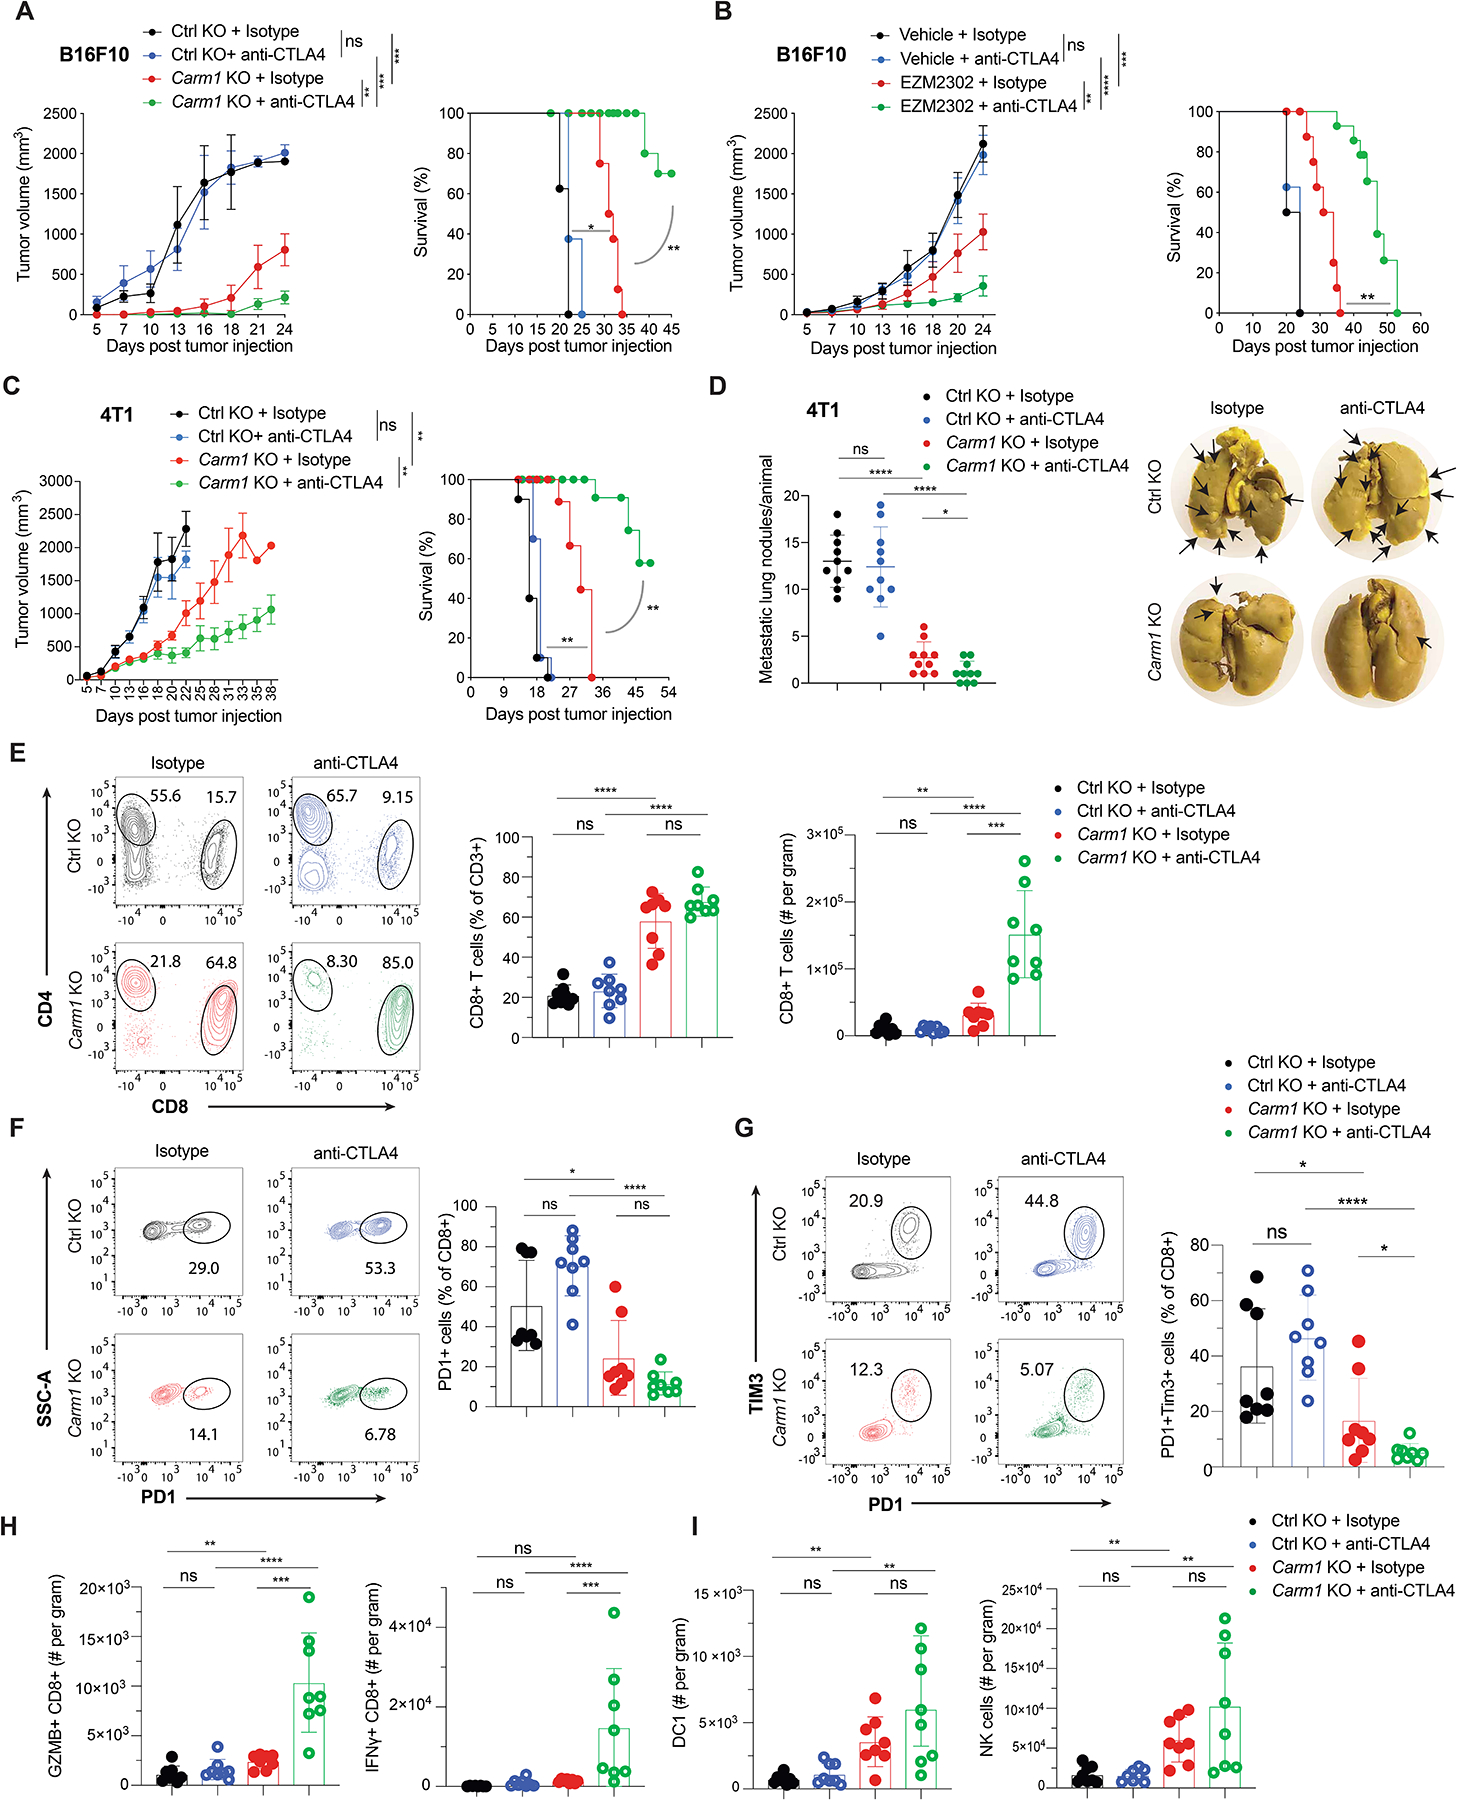
A. reatment of Carm1-KO or control-KO B16F10 tumors with CTLA-4 or isotype control antibodies (n=8 mice/group). Tumor growth (left) and survival of tumor bearing mice (right) are shown. Mice bearing comparable tumor volume (~50mm3) were randomized into different treatment groups.
B. Treatment of B16F10 tumors with CARM1 inhibitor (EZM2302) or vehicle control in combination with CTLA-4 or isotype control antibodies (n=8 mice/group). EZM2302 (150mg/kg b.i.d.) was orally administered for 2 weeks (days 7–21).
C. Treatment of Carm1-KO or control-KO 4T1 tumors with anti-CTLA-4 or isotype control antibodies (n=8 mice/group).
D. hange in number of spontaneous lung metastases (left) and representative images of lung metastases formed by 4T1 tumors treated as described in C (right) (n=8 mice/group).
E. Quantification of tumor-infiltrating CD8 T cells in Carm1-KO and control-KO B16F10 tumors (n=8 mice/group) following treatment with CTLA-4 or isotype control antibodies (day 18 post tumor cell implantation). Representative flow plots (left) and quantification of CD8 T cells as percentage of CD3+ cells and per gram of tumor (middle and right, respectively).
F-G. Quantification of PD-1 positive and PD-1/Tim-3 double positive tumor-infiltrating CD8+ T cells for experiment described in E.
H-I. Quantification of CD8 T cells expressing effector markers (GZMB and IFNγ), migratory cross-presenting DCs (CD45+/CD3-/F4/80-/CD11c+/MHC-IIhigh/CD103+/CD11b-) and NK cells (CD45+/CD3-/CD49b+) per gram of tumor for experiment described in E.
Data shown are representative of two experiments. Two-way ANOVA was used to determine statistical significance for time points when all mice were viable for tumor measurement. Log-rank (Mantel-Cox) test was used to determine statistical significance for survival of mice. Bar graphs represent data summarized as mean ± S.E.M. and were analyzed by unpaired two-sided Mann-Whitney test, ****P < 0.0001; ***P < 0.001; **P < 0.01; *P < 0.05; n.s., non-significant.