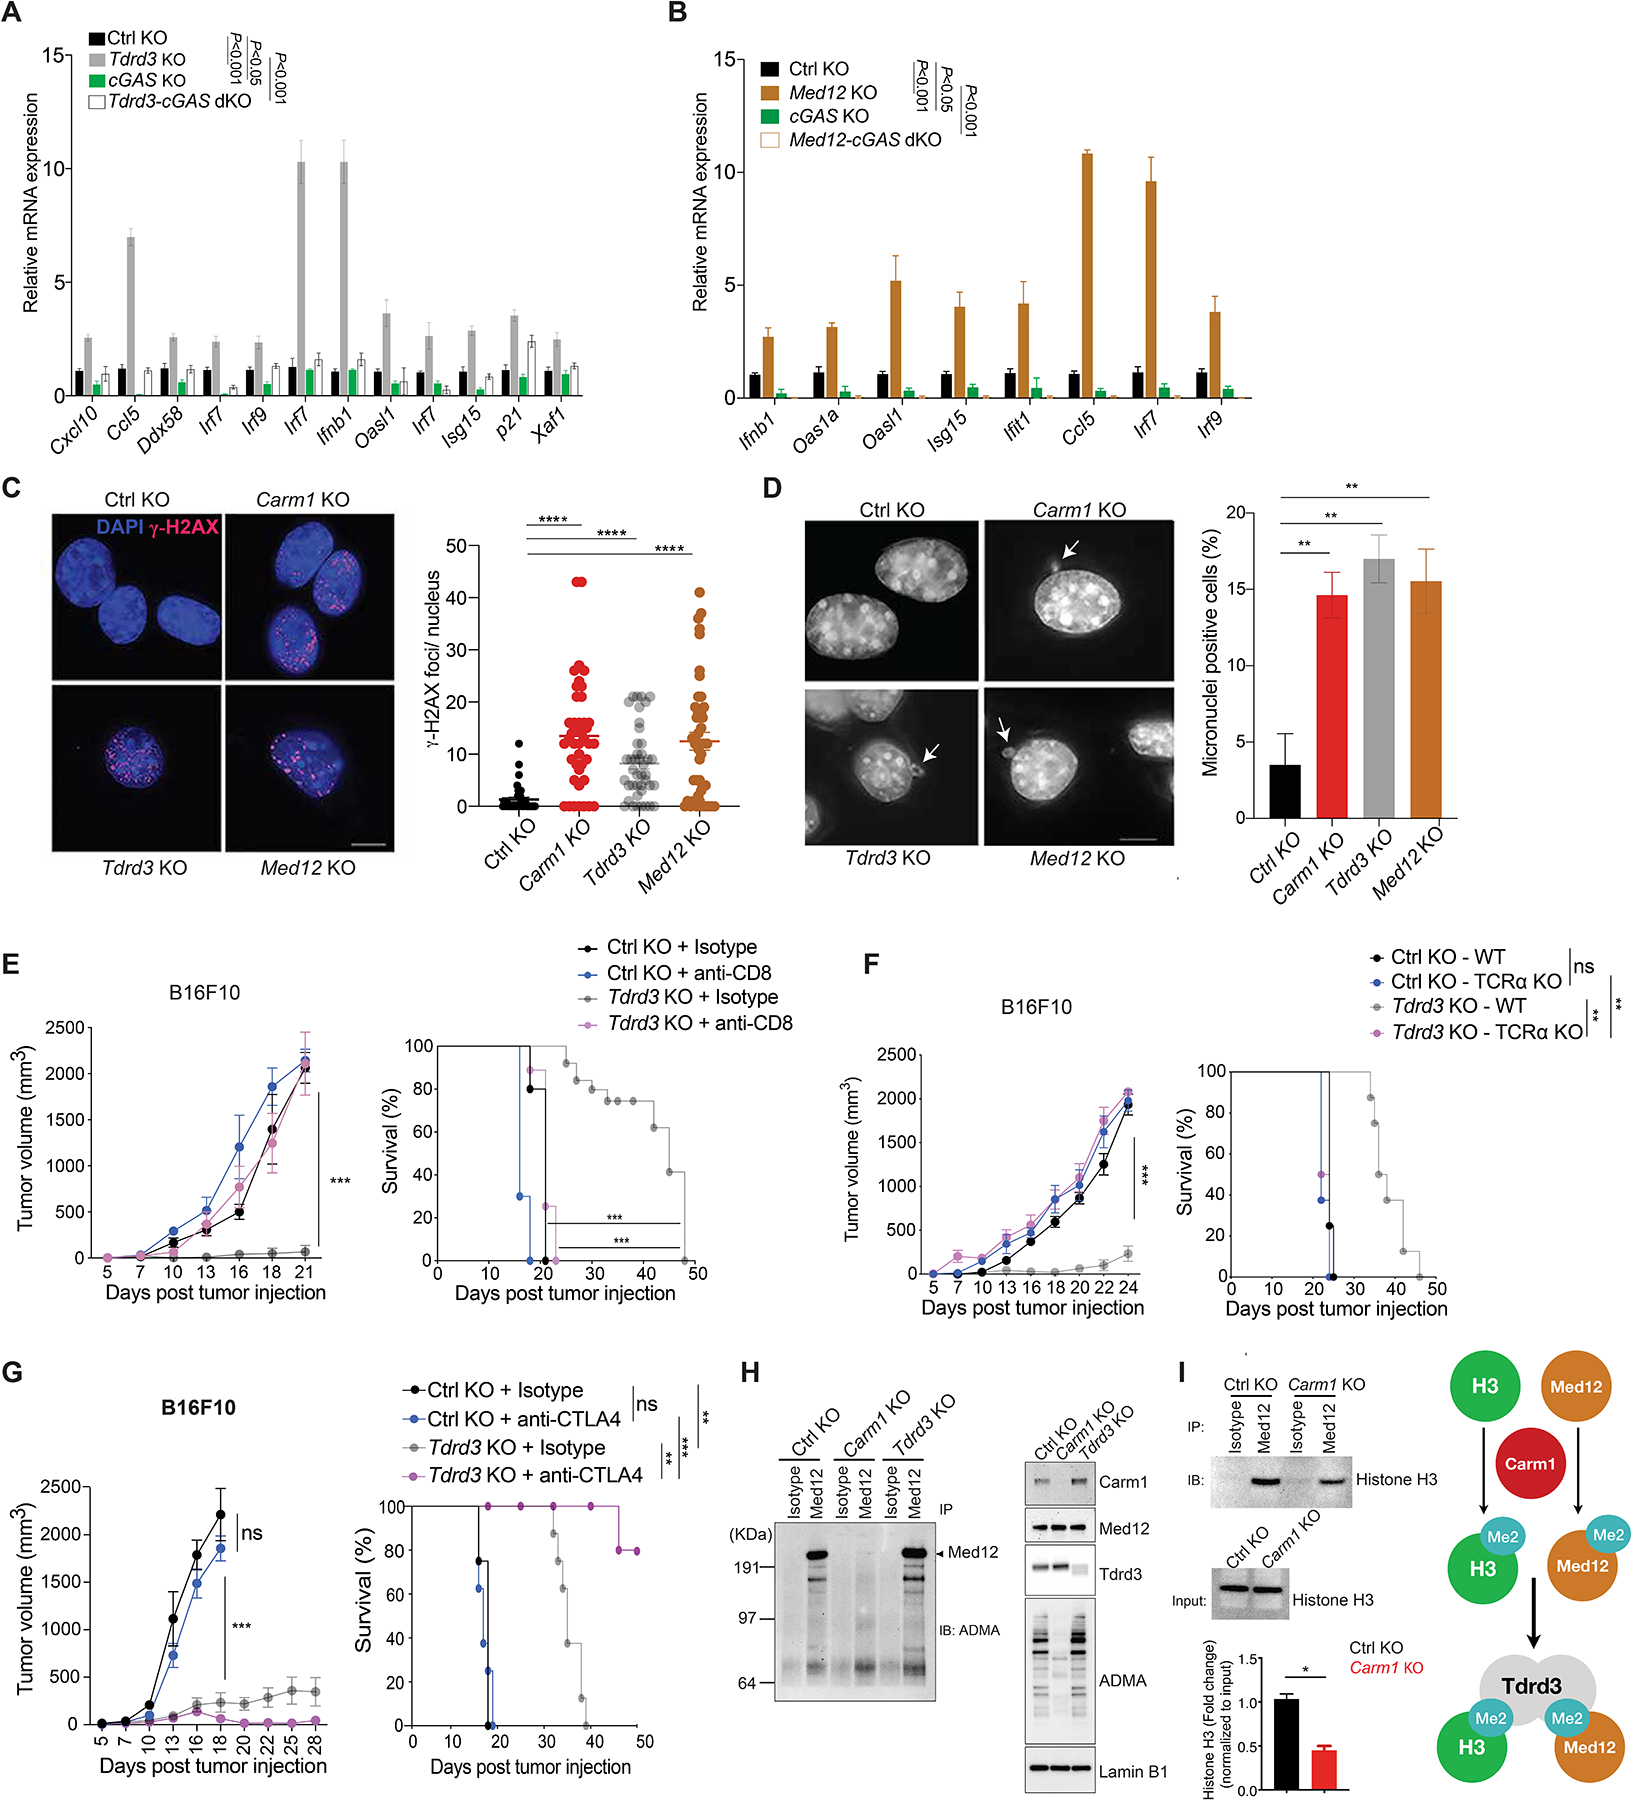
Figure 6. Tdrd3 and Med12 are downstream effectors of Carm1.

A. Comparison of ISG expression in control-KO, Tdrd3-KO, cGAS-KO and Tdrd3/cGAS dKO B16F10 cells by RT-qPCR (n=3/group).
B. Comparison of ISG expression in control-KO, Med12-KO, cGAS-KO and Med12/cGAS dKO B16F10 cells by RT-qPCR (n=3/group).
C. Immunofluorescence analysis of dsDNA damage by γH2AX antibody staining (red foci; nuclei labeled with DAPI) in control-KO, Carm1-KO, Tdrd3-KO and Med12-KO B16F10 tumor cells (left). Images for control-KO and Carm1-KO reshown from Fig. 4 to illustrate comparison to other KO tumor cell lines. Quantification of number of γH2AX foci/nucleus for each cell line (right). Scale bar – 10μM.
D. Analysis of micronuclei in control-KO, Carm1-KO, Tdrd3-KO and Med12-KO B16F10 tumor cells using DAPI as a DNA stain. Representative images (left) and quantification of percentage of cells with micronuclei (right). Scale bar – 10μM.
E. Tumor growth and survival of mice bearing control-KO and Tdrd3-KO B16F10 tumors. Mice were treated with CD8 T cell depleting or isotype control antibodies (n=8–10 mice/group).
F. Tumor growth and survival of control-KO and Tdrd3-KO B16F10 tumors in immunocompetent and T cell deficient (Tcra KO) mice (n=8–10 mice/group).
G. Tumor growth and survival of anti-CTLA-4 or isotype control antibody treated of mice bearing Tdrd3-KO or control-KO B16F10 tumors (n=8 mice/group).
H. Arginine methylation of Med12 by Carm1. Immunoprecipitation of Med12 protein from nuclear extracts of control-KO, Carm1-KO or Tdrd3-KO B16F10 tumor cells, followed by Western blot detection with an antibody specific for asymmetric dimethylation of arginine residues (ADMA, left). Western blot analysis of nuclear extracts from the same cell lines with antibodies for the indicated proteins (right).
I. Effect of Carm1 on interaction of Med12 with histone H3. Immunoprecipitation of Med12 protein from control-KO or Carm1-KO B16F10 tumor cells, followed by Western blot detection with histone H3 antibody. Input levels of histone H3 in immunoprecipitated samples is shown (middle); quantification of histone H3 bound to Med12 normalized to total histone H3 (bottom). Graph shows proposed biochemical interactions (right).
Two-way ANOVA was used to determine statistical significance for time points when all mice were viable for tumor measurement. Statistical significance for survival of mice in each treatment group was calculated by Log-rank (Mantel-Cox) test. Bar graphs represent data summarized as mean ± S.E.M. and were analyzed by unpaired two-sided Mann-Whitney test. Data are representative of three (A-H) and two (I) experiments, *p < 0.05, **p < 0.01, ***p < 0.001, ****p < 0.0001, ns (non-significant).
