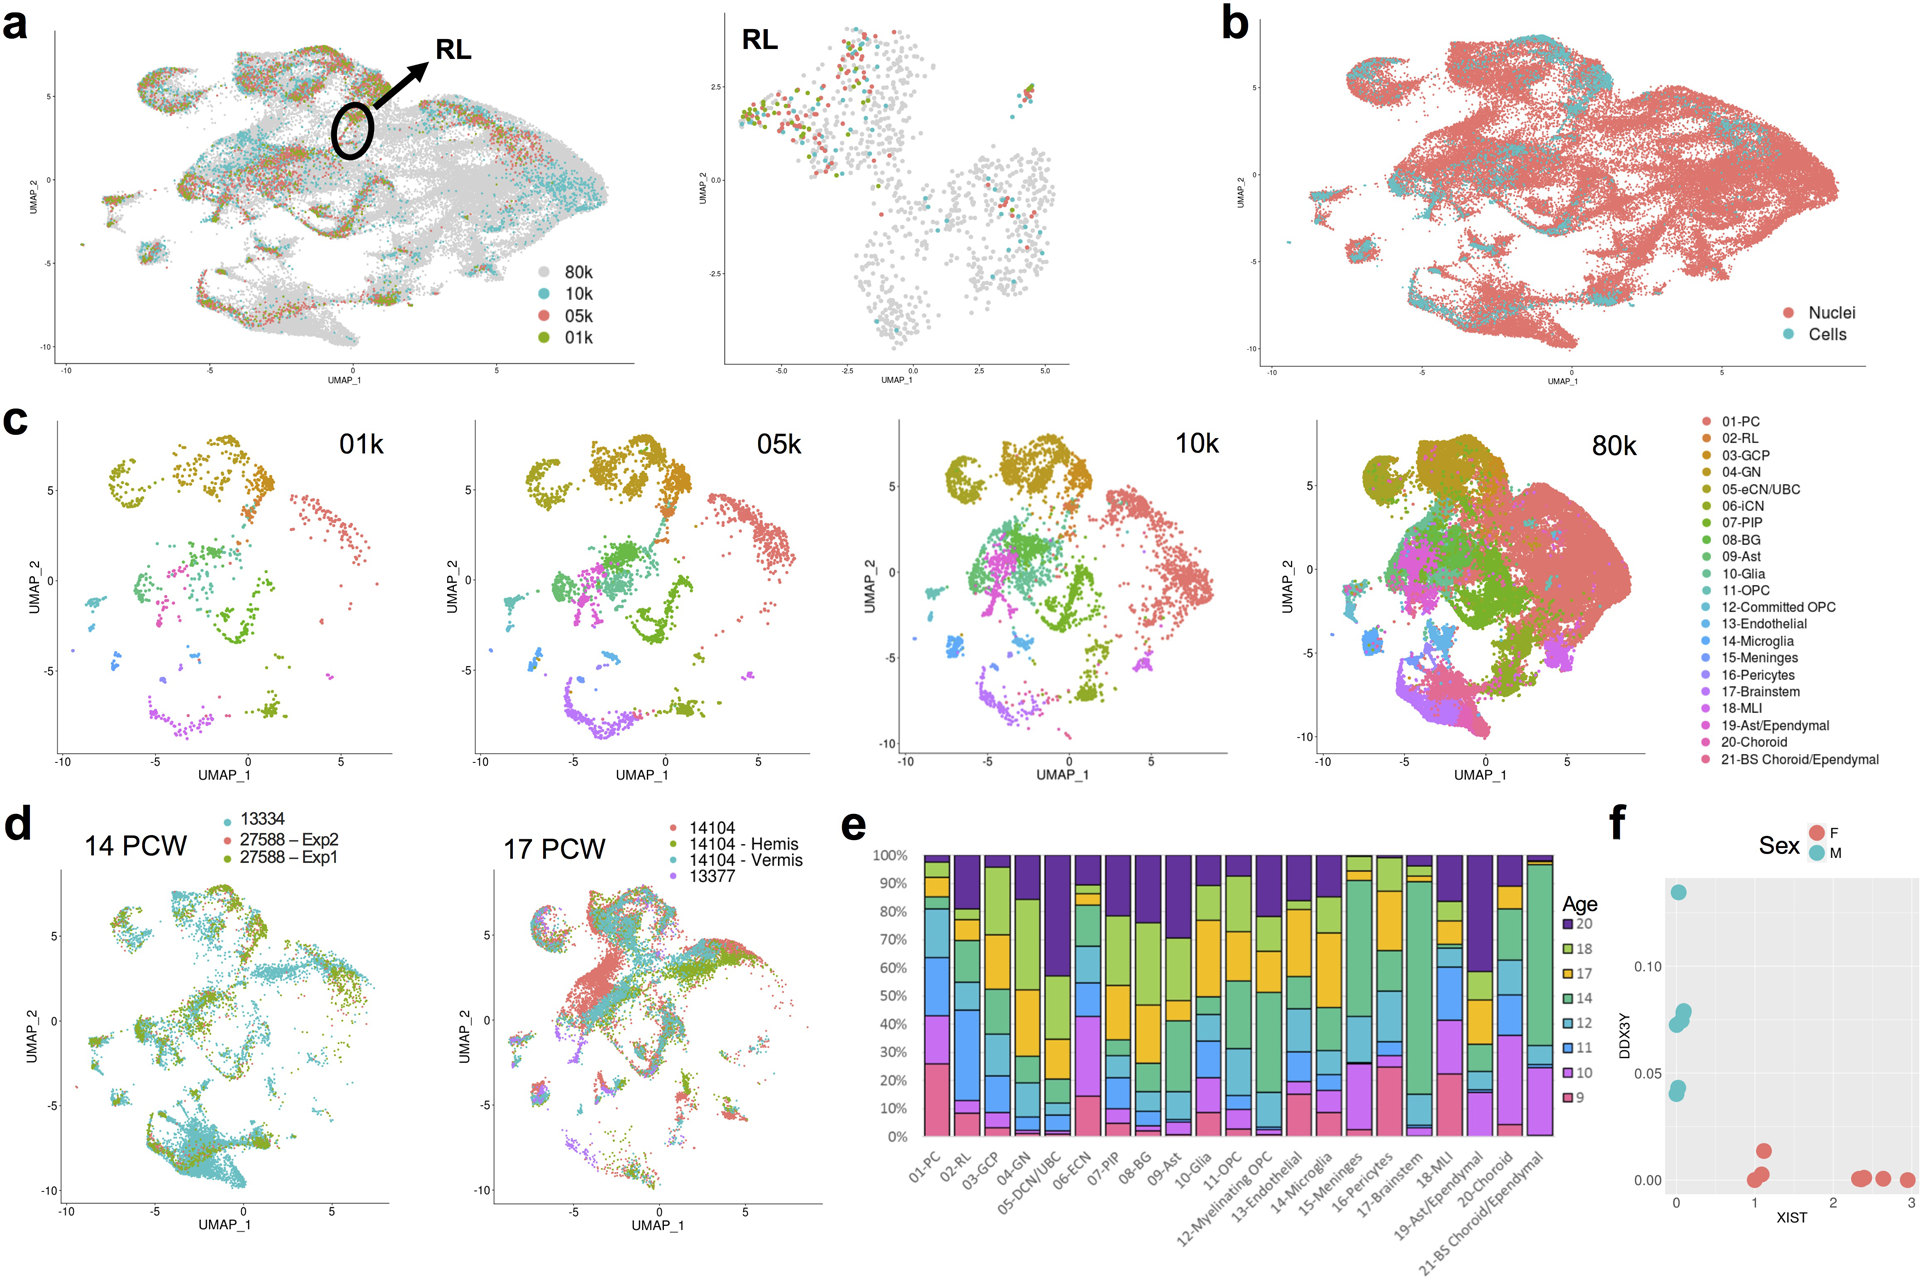
Extended Data Fig. 5. Quality control related analyses of snRNA-seq data.

a, UMAP visualization of 69,174 human cerebellar nuclei colored by dataset (n = 1,076 for 01k; 3,530 for 05k; 4,960 for 10k; 59,608 for 80k). Rhombic lip (RL) is circled. UMAP visualization of 1,018 RL nuclei colored by dataset at right (nuclei numbers: n = 41 for 01k; 88 for 05k; 67 for 10k; 822 for 80k). b, The same UMAP as in a with nuclei colored by type (n = 4,462 cells; 64,712 nuclei). c, The same UMAP as in a and b showing nuclei from each dataset. Nuclei are colored by cell type. d, The same UMAP as in a-c showing nuclei sampled from same age biological and technical replicates (n = 11,213 for 14 PCW; 8,453 nuclei for 13334; 2,098 cells for 27588 Exp1; 662 cells for 27588 Exp2; n = 15,556 for 17 PCW; 524 cells for 13377; 8,540 nuclei for 14104; 3,364 nuclei for 14104h; 3,128 nuclei for 14104v). e, Stacked bar chart shows the percentage of age sampled in each of the 21 cell types. Bar colors represent age sampled in postconceptional weeks (9–20 PCW). f, Expression of the female-specific non-coding RNA XIST and the chromosome Y specific gene DDX3Y show correct sex assignment for female (salmon) and male (turquoise) samples (n = 14 female; 12 male).
