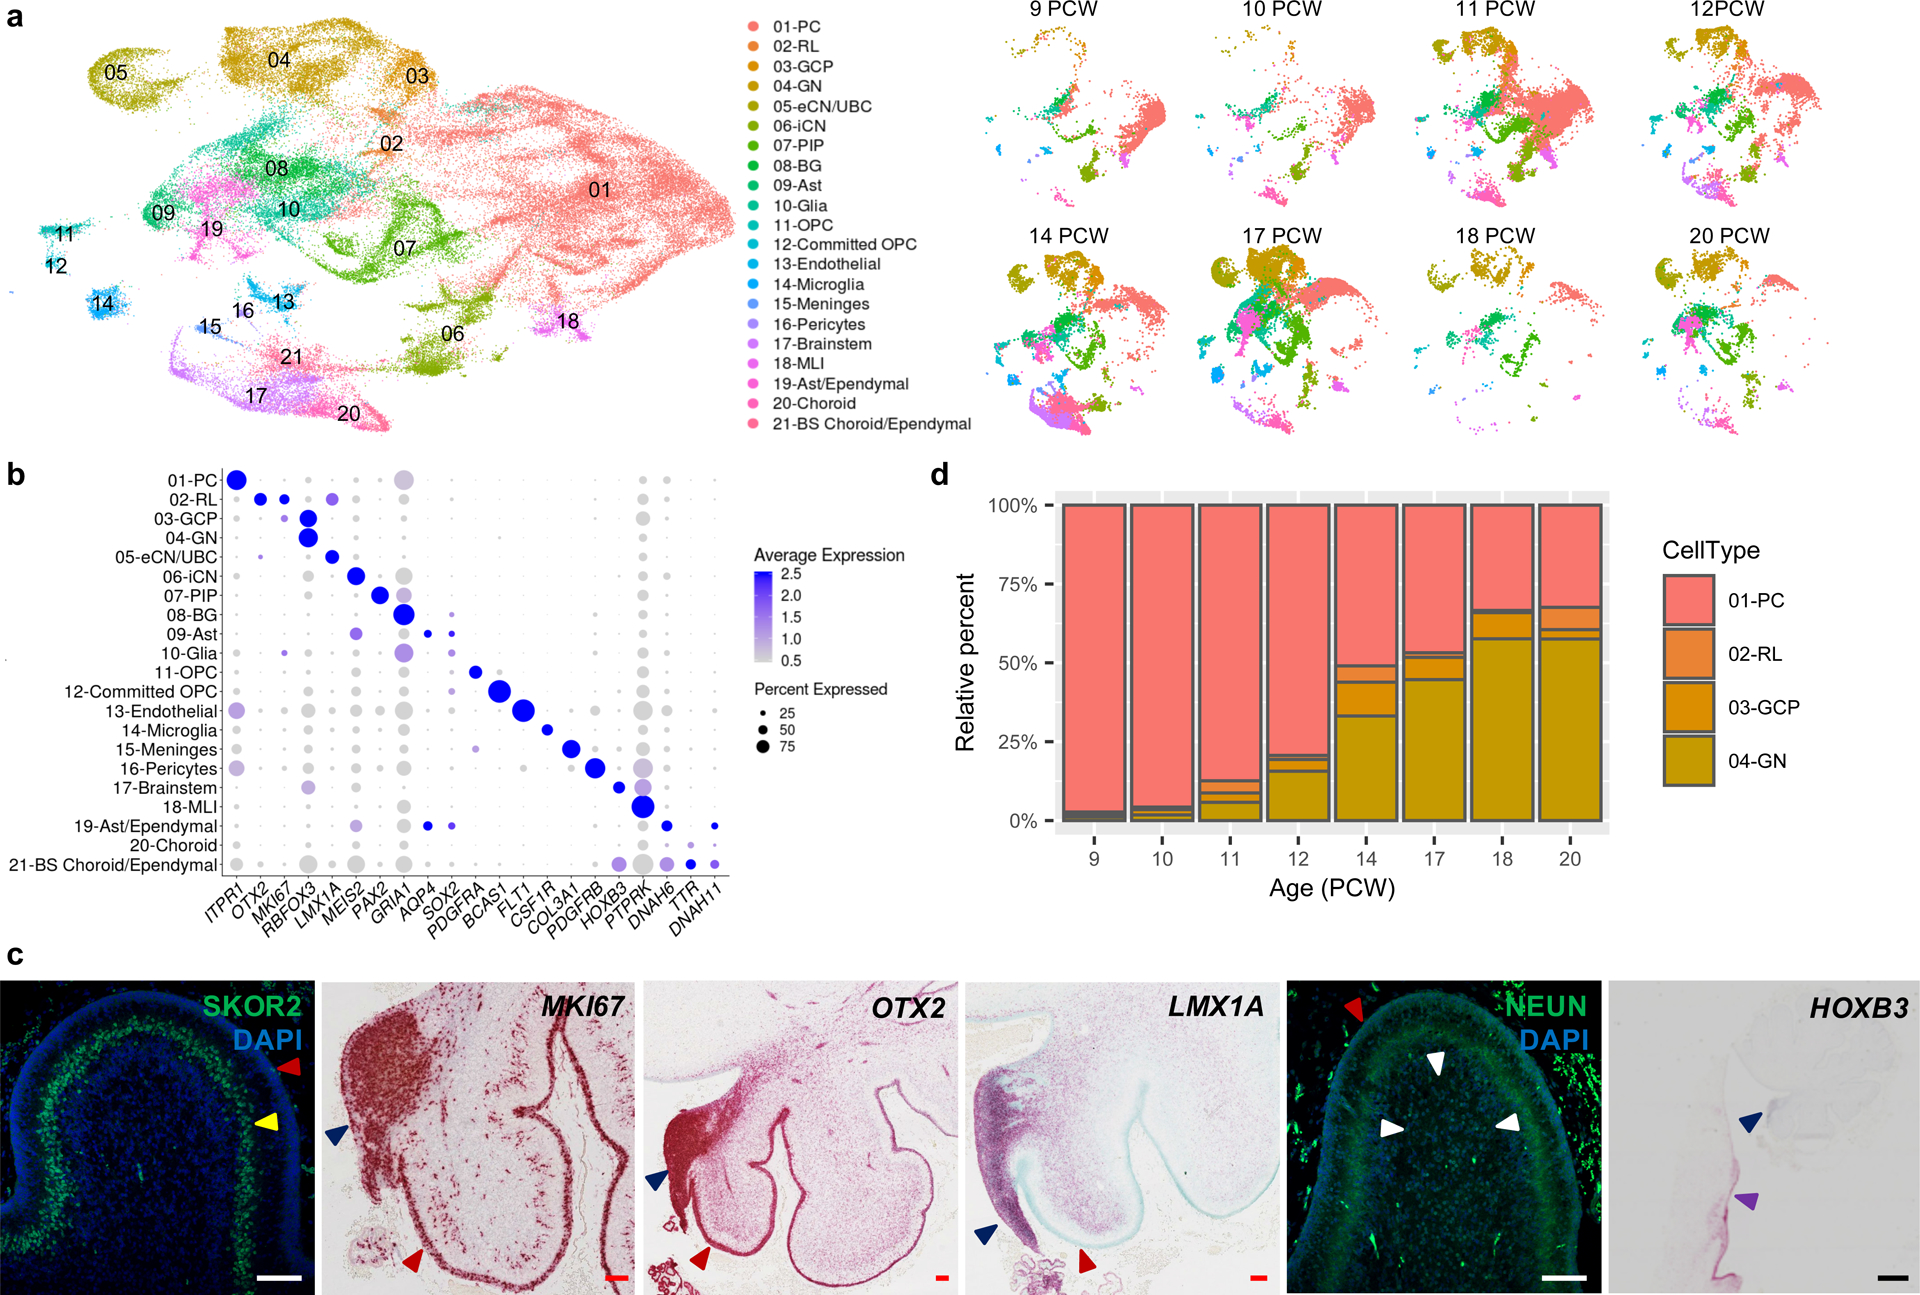
Fig. 3 |. Identifying the major cell types of the developing human cerebellum.

a, UMAP visualization of 67,174 human cerebellar nuclei colored by cluster identity from Louvain clustering and annotated on the basis of marker genes. The same UMAP is plotted at right, showing only nuclei from each age (nuclei numbers from left to right: n = 5,003 for 9 PCW; 2,329 for 10 PCW; 20,364 for 11 PCW; 7,119 for 12 PCW; 11,213 for 14 PCW; 15,556 for 17 PCW; 1,617 for 18 PCW; 5,177 for 20 PCW). b, Dot plot showing the expression of one selected marker gene per cell type. The size of the dot represents the percentage of nuclei within a cell type in which that marker was detected and its color represents the average expression level. Statistics are presented in Supplementary Table 9. c, Midsagittal sections of the human fetal cerebellum at 18 PCW stained with selected marker genes for Purkinje cells (SKOR2), proliferation (MKI67), RL (OTX2 and LMX1A), granule neurons (NEUN), and brainstem (HOXB3). Adjacent sections from one sample were stained for OTX2 and HOXB3; a minimum of 3 sections from each of 3 samples were stained for the other markers. The EGL, PCL, internal granule cell layer, RL and brainstem are indicated by red, yellow, white, blue and purple arrowheads, respectively. Sections are counterstained using DAPI for immunohistochemistry (SKOR2, NEUN) or Fast Green for in situ hybridization (MKI67, OTX2, LMX1A, HOXB3). Scale bar = 100 um and 1 mm (HOXB3). LMX1A was used previously in Fig. 3G of Haldipur et al., 2019. d, Stacked bar charts show the percentage of the four major cell types from each age sampled. Bar colors represent Purkinje cells (PC), rhombic lip (RL), granule cell precursors (GCP), or granule neurons (GN).
