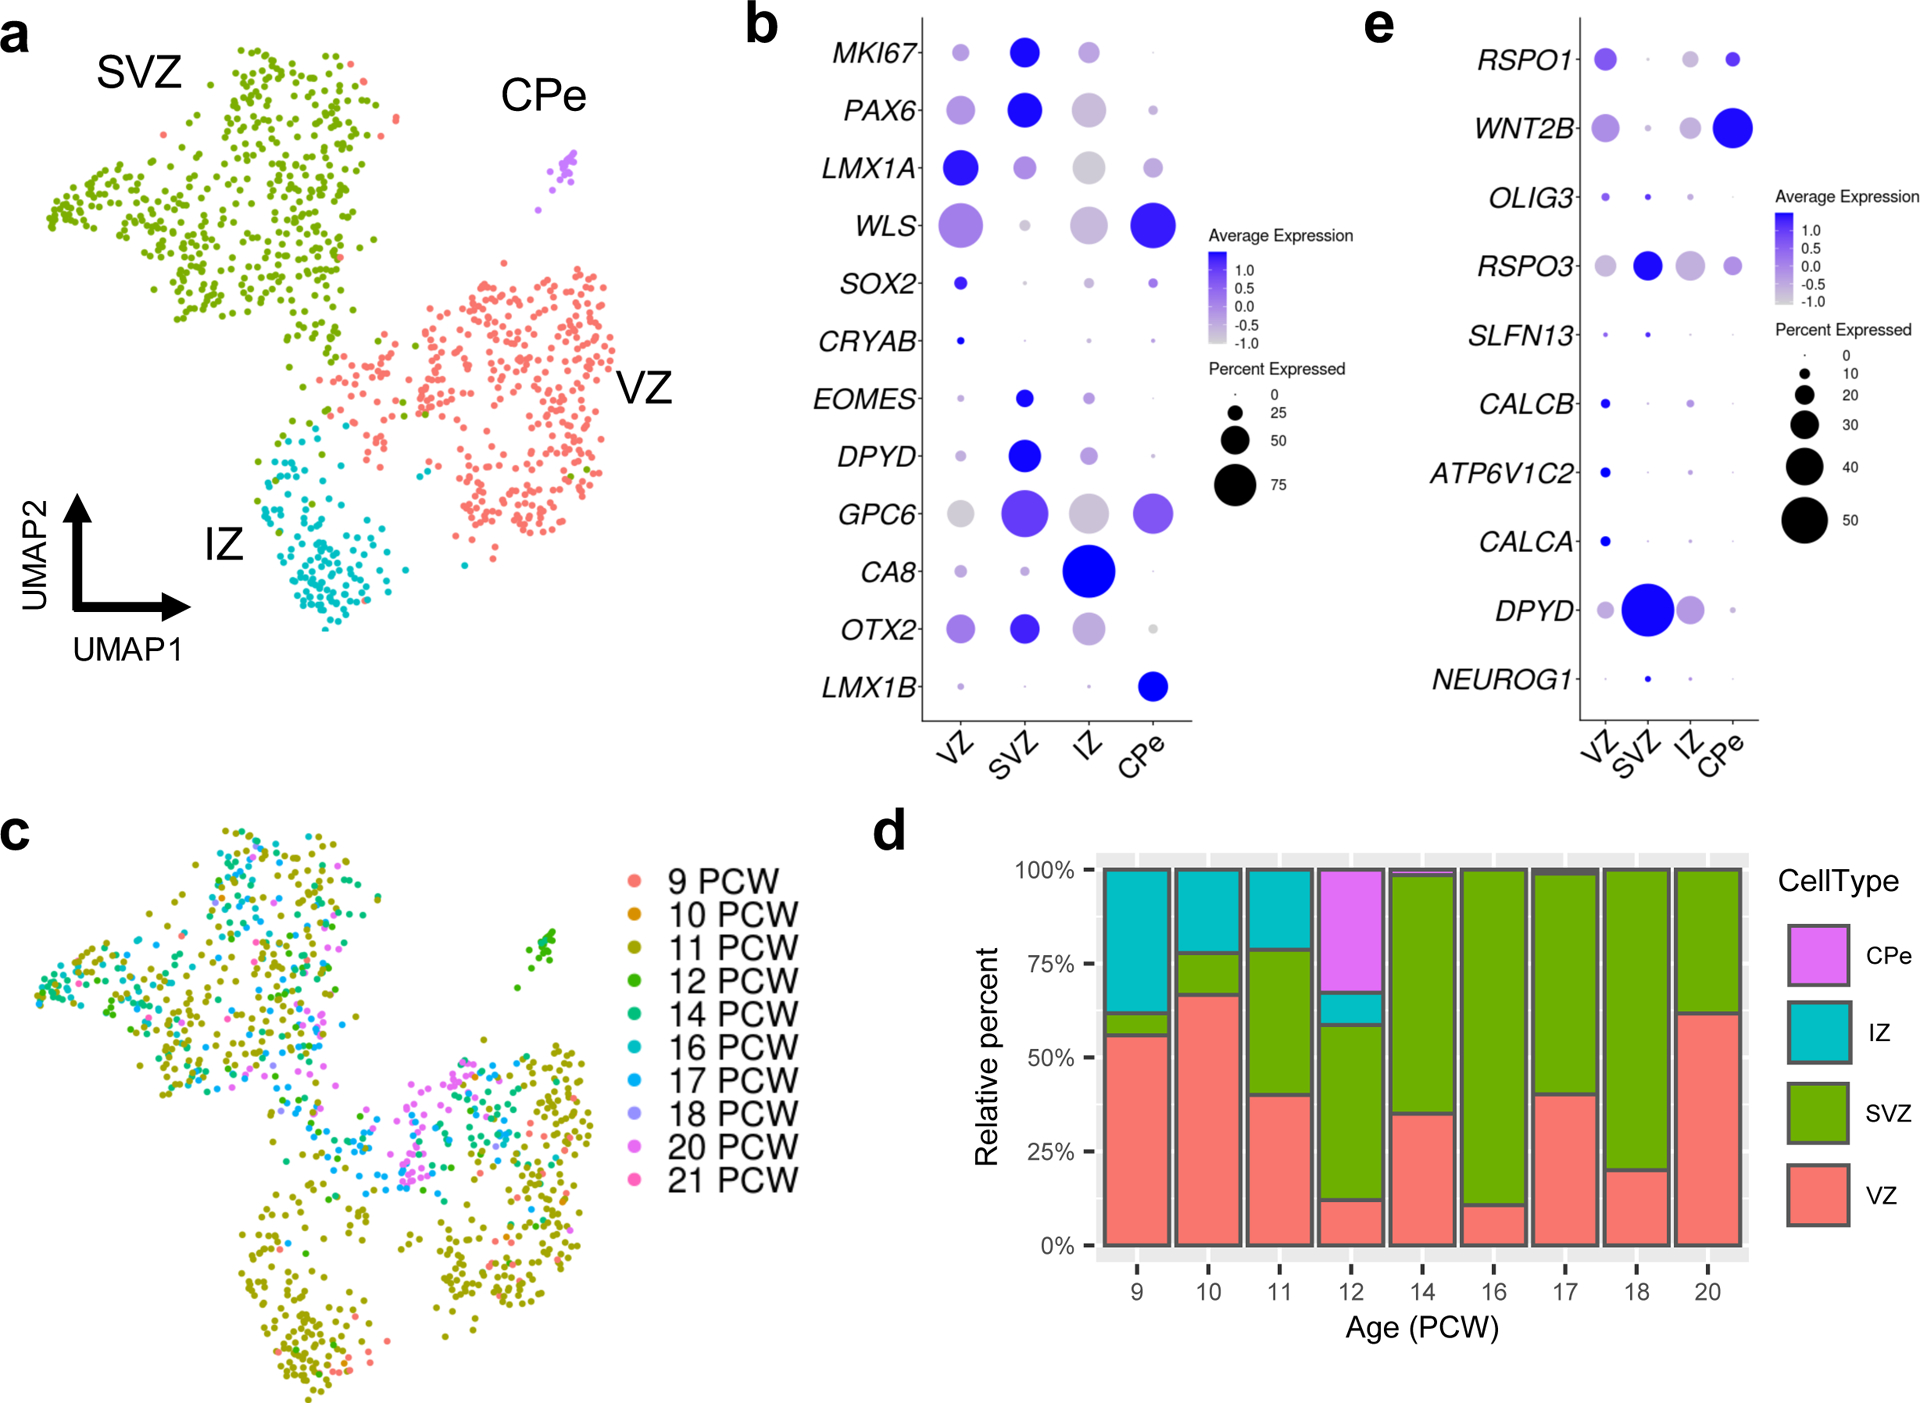
Fig. 4 |. Analysis of RL compartments at single-cell resolution.

a, UMAP visualization and marker-based annotation of the RL subclusters (n = 1,018 nuclei; 466 for SVZ; 390 for VZ; 135 for IZ; 21 for CPe). CPe, choroid plexus epithelium; IZ, intermediate zone; SVZ, subventricular zone; VZ ventricular zone. b, Dot plot showing the expression of selected marker genes in subclusters. c, The same UMAP as in a with nuclei colored by sample age (n = 34 for 9 PCW; 9 for 10 PCW, 535 for 11 PCW; 58 for 12 PCW; 137 for 14 PCW; 56 for 16 PCW; 97 for 17 PCW, 5 for 18 PCW; 81 for 20 PCW; 6 for 21 PCW). d, Stacked bar charts show the percentage of the RL subclusters by sample age. e, Dot plot showing the expression of the top 10 most differentially expressed genes from the spatial transcriptional analysis of the RL (Fig. 2e and Supplementary Table 3).
