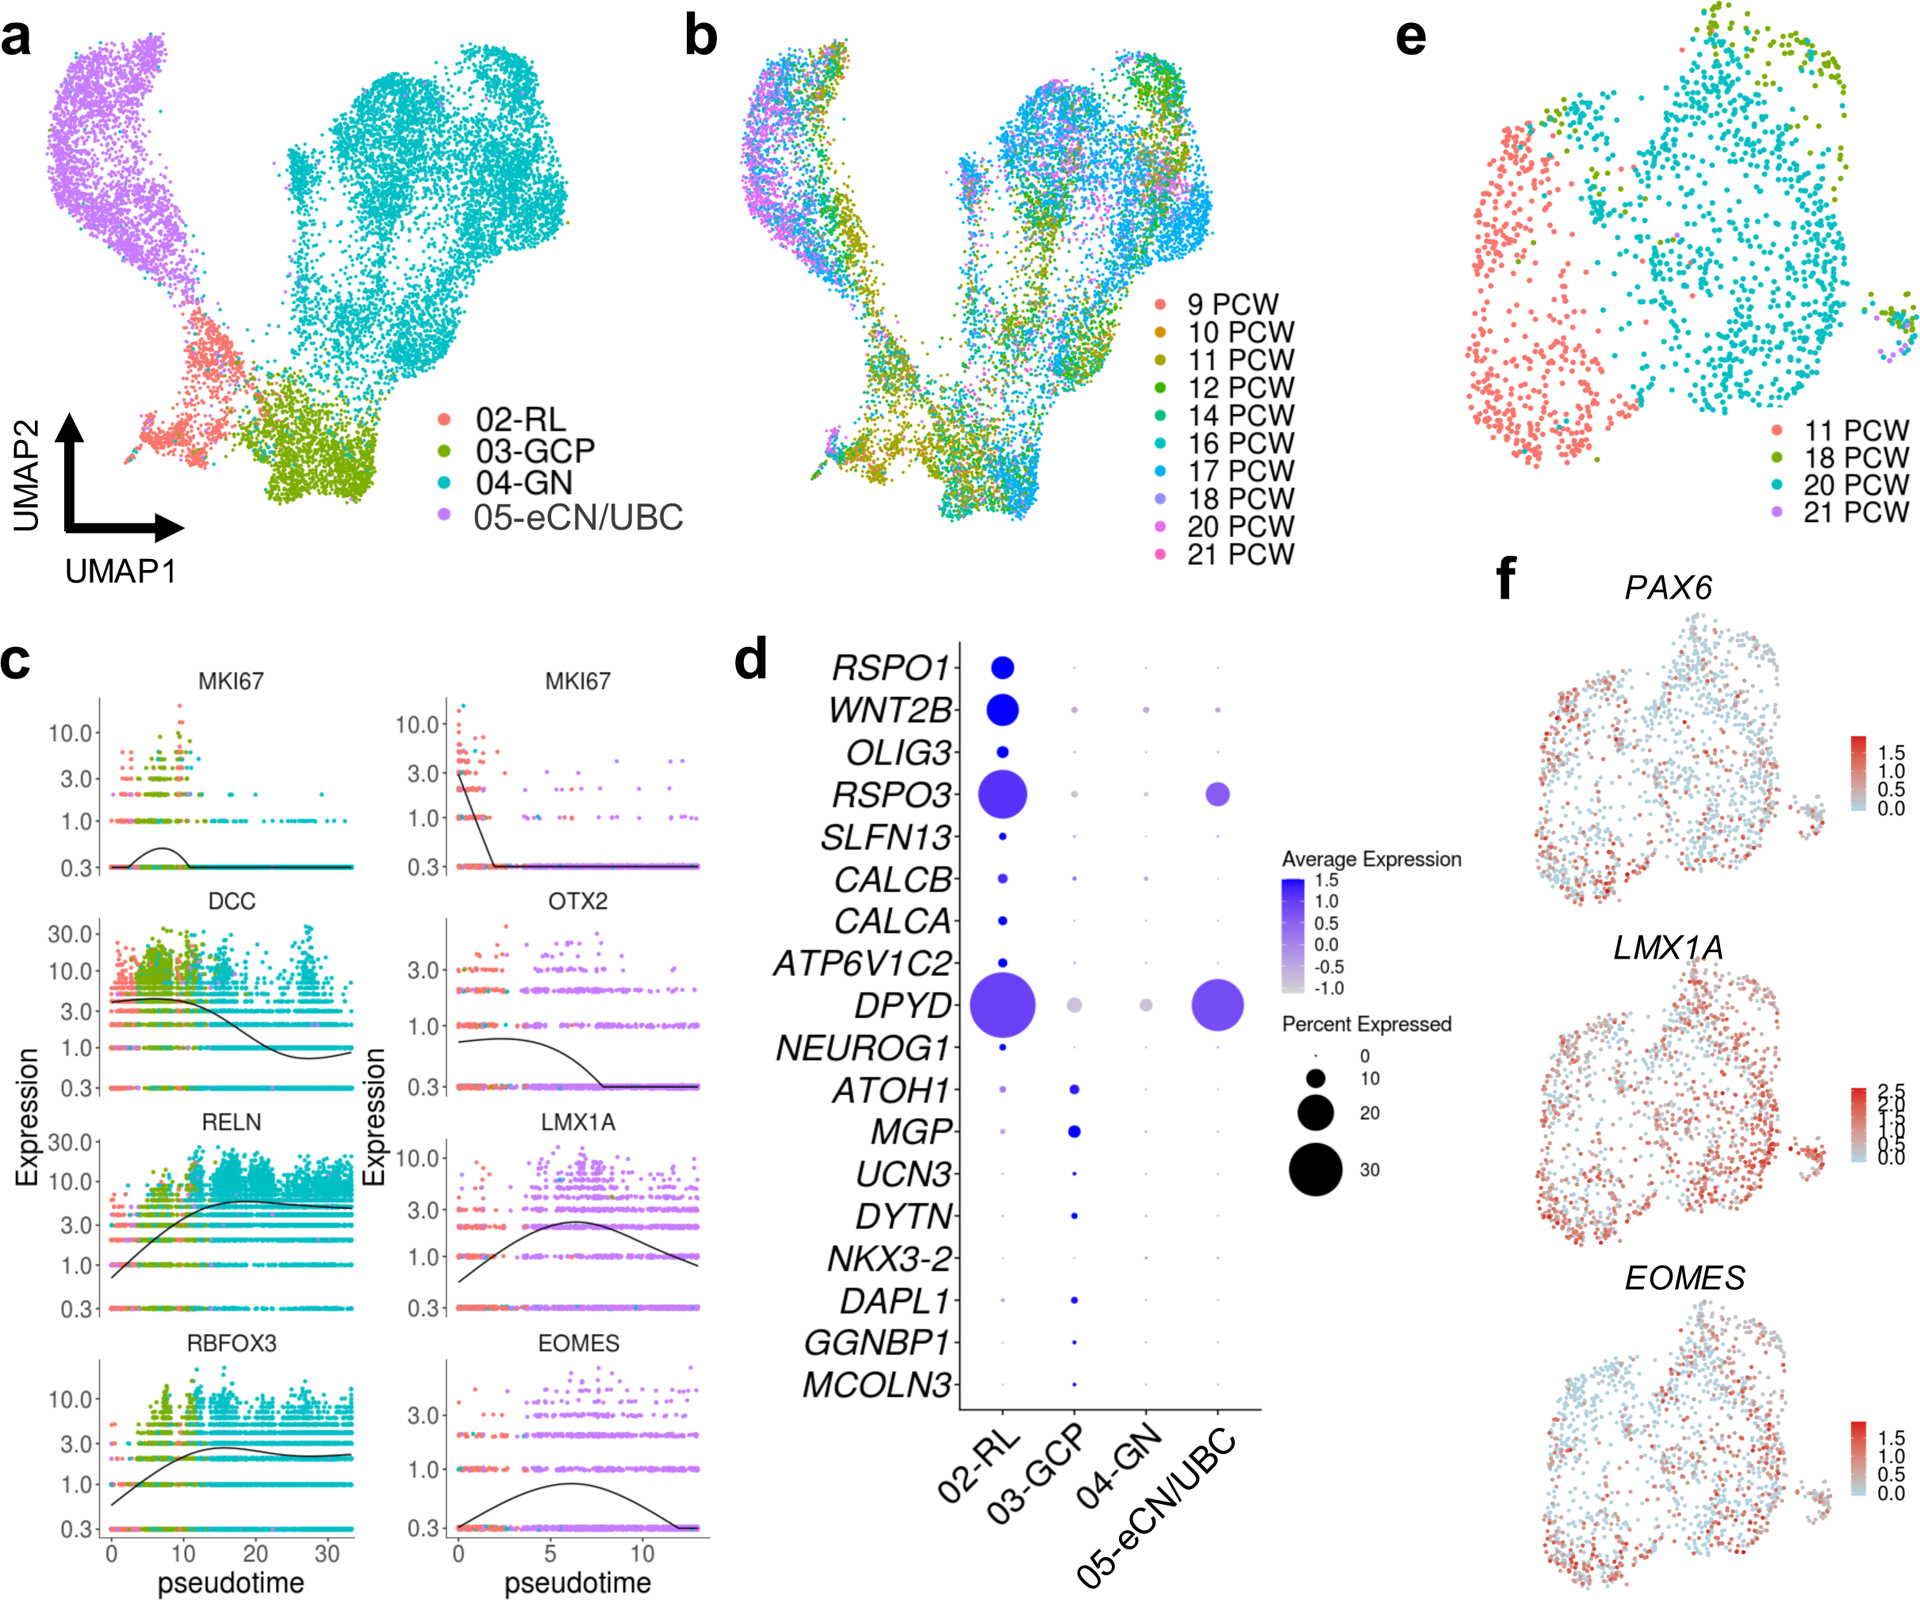
Fig. 5 |. Characterization of the RL trajectory.

a, UMAP visualization and marker-based annotation of cell types that originate from the RL (n = 12,243; 1,018 for RL; 1,659 for GCP; 6,727 for GN; 2,839 for eCN/UBC). eCN/UBC, excitatory cerebellar nuclei/unipolar brush cells; GCP, granule cell progenitors; GN, granule neurons; RL, rhombic lip. b, The same UMAP as in a with nuclei colored by sample age (n = 120 for 9 PCW; 61 for 10 PCW; 2,190 for 11 PCW; 1,053 for 12 PCW; 1,663 for 14 PCW; 432 for 16 PCW; 4,410 for 17 PCW; 627 for 18 PCW; 1,626 for 20 PCW; 89 for 21 PCW). c, Kinetics plot showing the relative expression of RL trajectory marker genes across developmental pseudotime. Dots are colored according to cell types as in a. d, Dot plot showing the expression of the top 10 most differentially expressed genes from the spatial transcriptional analysis of RL and EGL (Fig. 2e and Supplementary Table 3). e, UMAP visualization of the eCN/UBC cluster including 11, 18, 20, 21 PCW samples. Nuclei are colored by sample age (n = 1,424; 436 for 11 PCW; 138 for 18 PCW; 842 for 20 PCW; 8 for 21 PCW). f, The same UMAP as in e with nuclei colored by expression level for the indicated gene.
