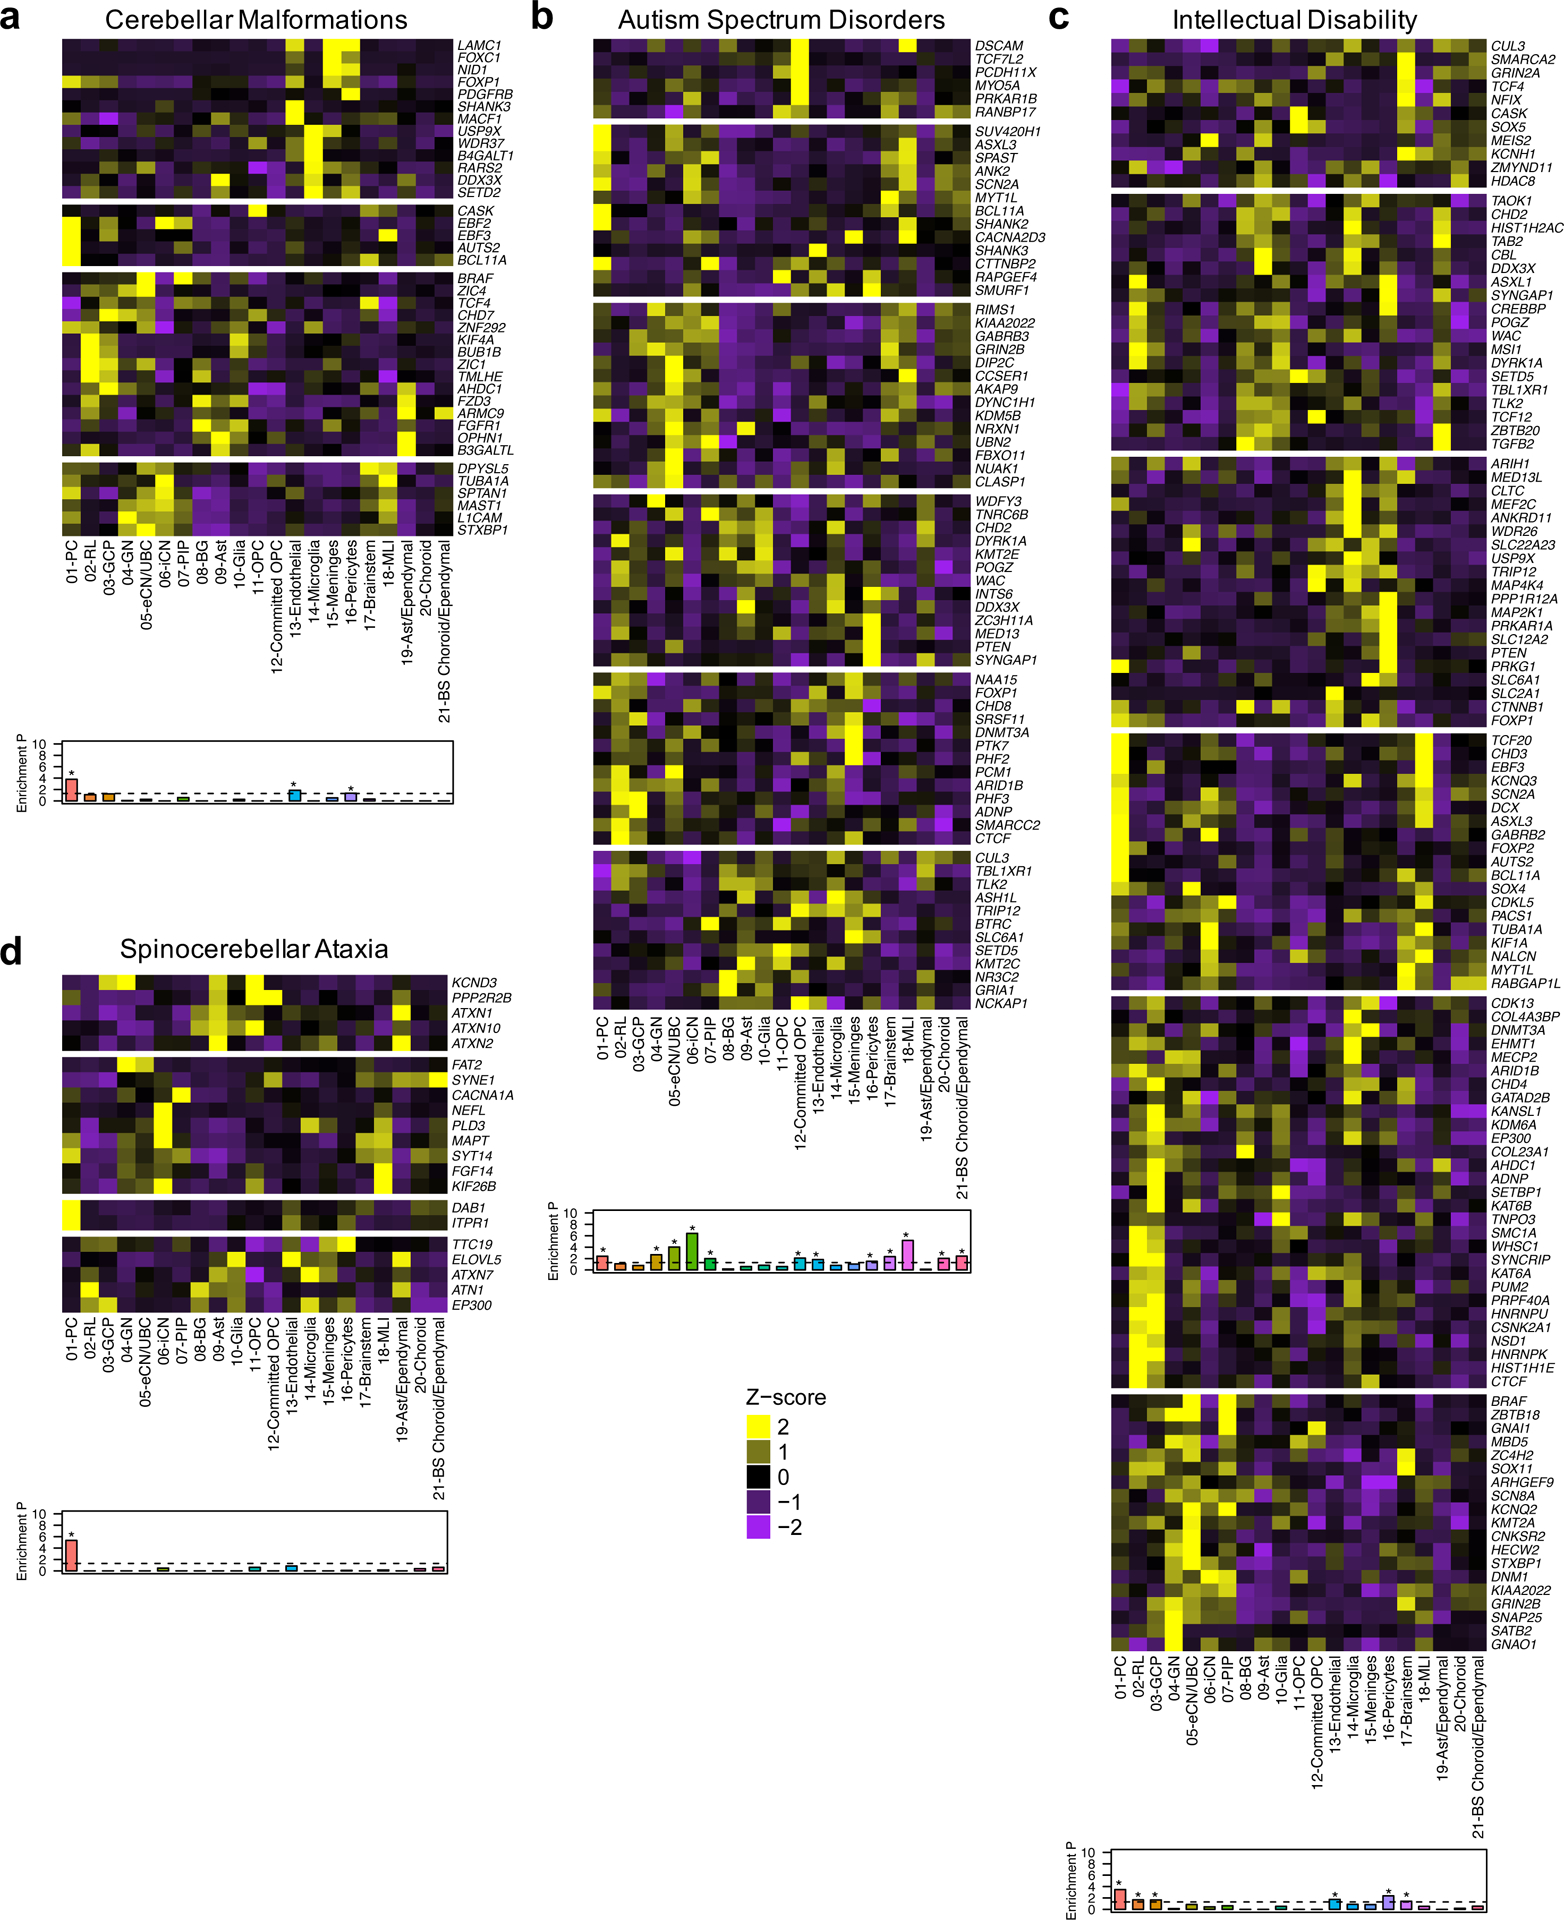
Fig. 8 |. Cerebellar cell type enrichment in pediatric and adult diseases.

a-d, Heatmaps of mean expression per fetal cerebellar cell type for genes associated with pediatric (a, cerebellar malformations; b, autism spectrum disorders; c, intellectual disability) or adult (d, spinocerebellar ataxia) diseases. Color scheme is based on Z-score distribution. In the heatmaps, each row represents one gene and each column represents a single cell type. Gene expression was clustered by row. Horizontal white lines indicate branch divisions in row dendrograms (not shown). The full list of genes is provided in Supplementary Table 11. Enrichment P values (-Log10 P value) for each cell type are shown in the bottom bar plots. Significance was determined by one-sample Z-test, two-tailed P value. The dashed line is the significance threshold. Asterisk (*) indicates significance (P < 0.05) after Bonferroni correction: cerebellar malformations (P = 1.63 × 10⁻⁴ for 01-PC; 0.01 for 13-Endothelial; < 0.05 for 16-Pericytes), autism spectrum disorders (P = 0.004 for 01-PC; 0.002 for 04-GN; 9.43 × 10⁻⁵ for 05-eCN/UBC; 3.78 × 10⁻⁷ for 06-iCN; 0.01 for 07-PIP; 0.008 for 12-Committed OPC; 0.02 for 13-Endothelial; 0.03 for 16-Pericytes; 0.005 for 17-Brainstem; 6.74 × 10⁻⁶ for 18-MLI; 0.009 for 20-Choroid; 0.004 for 21-BS Choroid/ependymal), intellectual disability (P = 3.30 × 10⁻⁴ for 01-PC; 0.02 for 02-RL; 0.02 for 03-GCP; 0.02 for 13-Endothelial; 0.004 for 16-Pericytes; 0.04 for 17-Brainstem), spinocerebellar ataxia (P = 4.56 × 10⁻⁶ for 01-PC).
