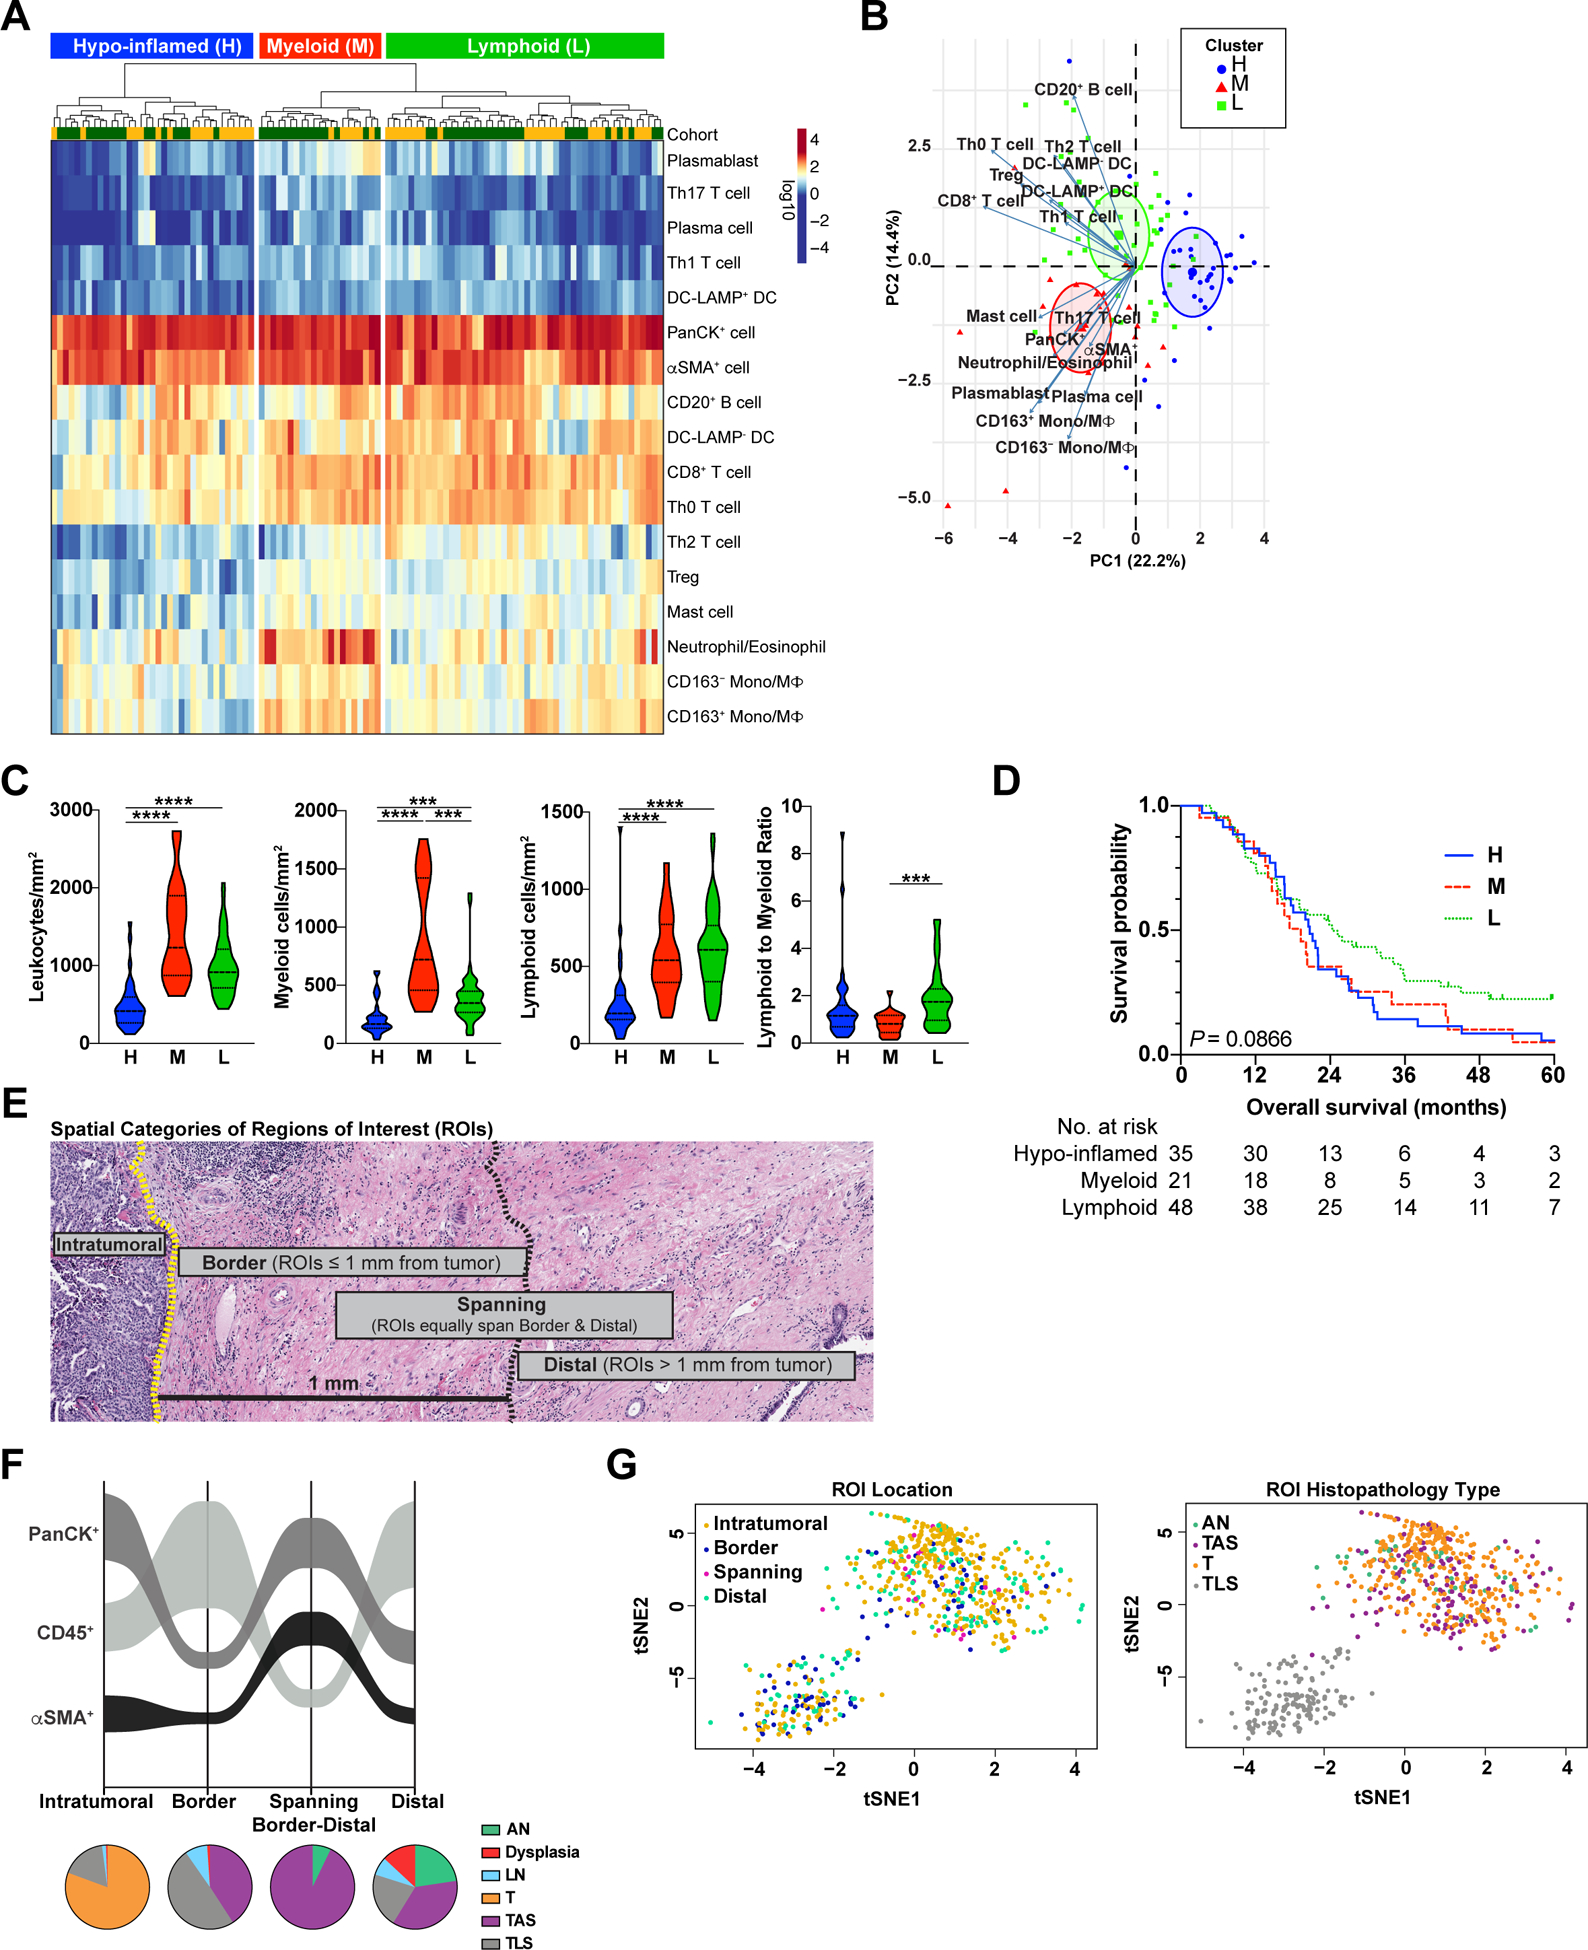
Figure 2. Global analysis of treatment-naïve PDAC surgical resections reveals distinct immune phenotypes.

(A) Unsupervised hierarchical clustering of treatment-naive PDACs from Cohorts 1 (yellow, uppermost row) and 2 (green, uppermost row) showing cell densities of indicated cell subsets (rows). Cell densities for each patient (columns) reflect cumulative densities from all analyzed ROIs per patient. (B) PCA of cell population densities from ‘A’. Each symbol represents one patient. H, hypo-inflamed cluster, n = 35; M, myeloid-enriched cluster, n = 21; L, lymphoid-enriched cluster, n = 48. (C) Indicated cell densities and ratios based on clusters from ‘A’. Statistical differences between groups were determined by Kruskal-Wallis tests with Dunn’s correction for multiple comparisons. (D) Kaplan-Meier curves displaying OS of patients based on clusters defined in ‘A’. P-value was determined by log-rank test. (E) Representative H&E of PDAC depicting spatial categories (‘Intratumoral’, ‘Border’, ‘Spanning’, and ‘Distal’) assigned to each individual region of interest (ROI) analyzed. (F) Sankey flow diagram representing relative densities (cells/mm2) of PanCK+ epithelial cells, CD45+ leukocytes, and αSMA+ mesenchymal support cells within treatment-naïve PDAC specimens across each spatial category (X-axis). Populations are sorted on the Y-axis from highest (top) to lowest (bottom) density, where ribbon width is scaled to density. Pie charts below represent relative contribution of different histopathologic region types (AN, Dysplasia, LN, T, TAS, TLS) within each spatial category. Number of individual ROIs evaluated is listed in Table S6. (G) t-SNE representation of cell density within individual ROIs (dots) color coded by ROI spatial location (left) and histopathology type (right).
