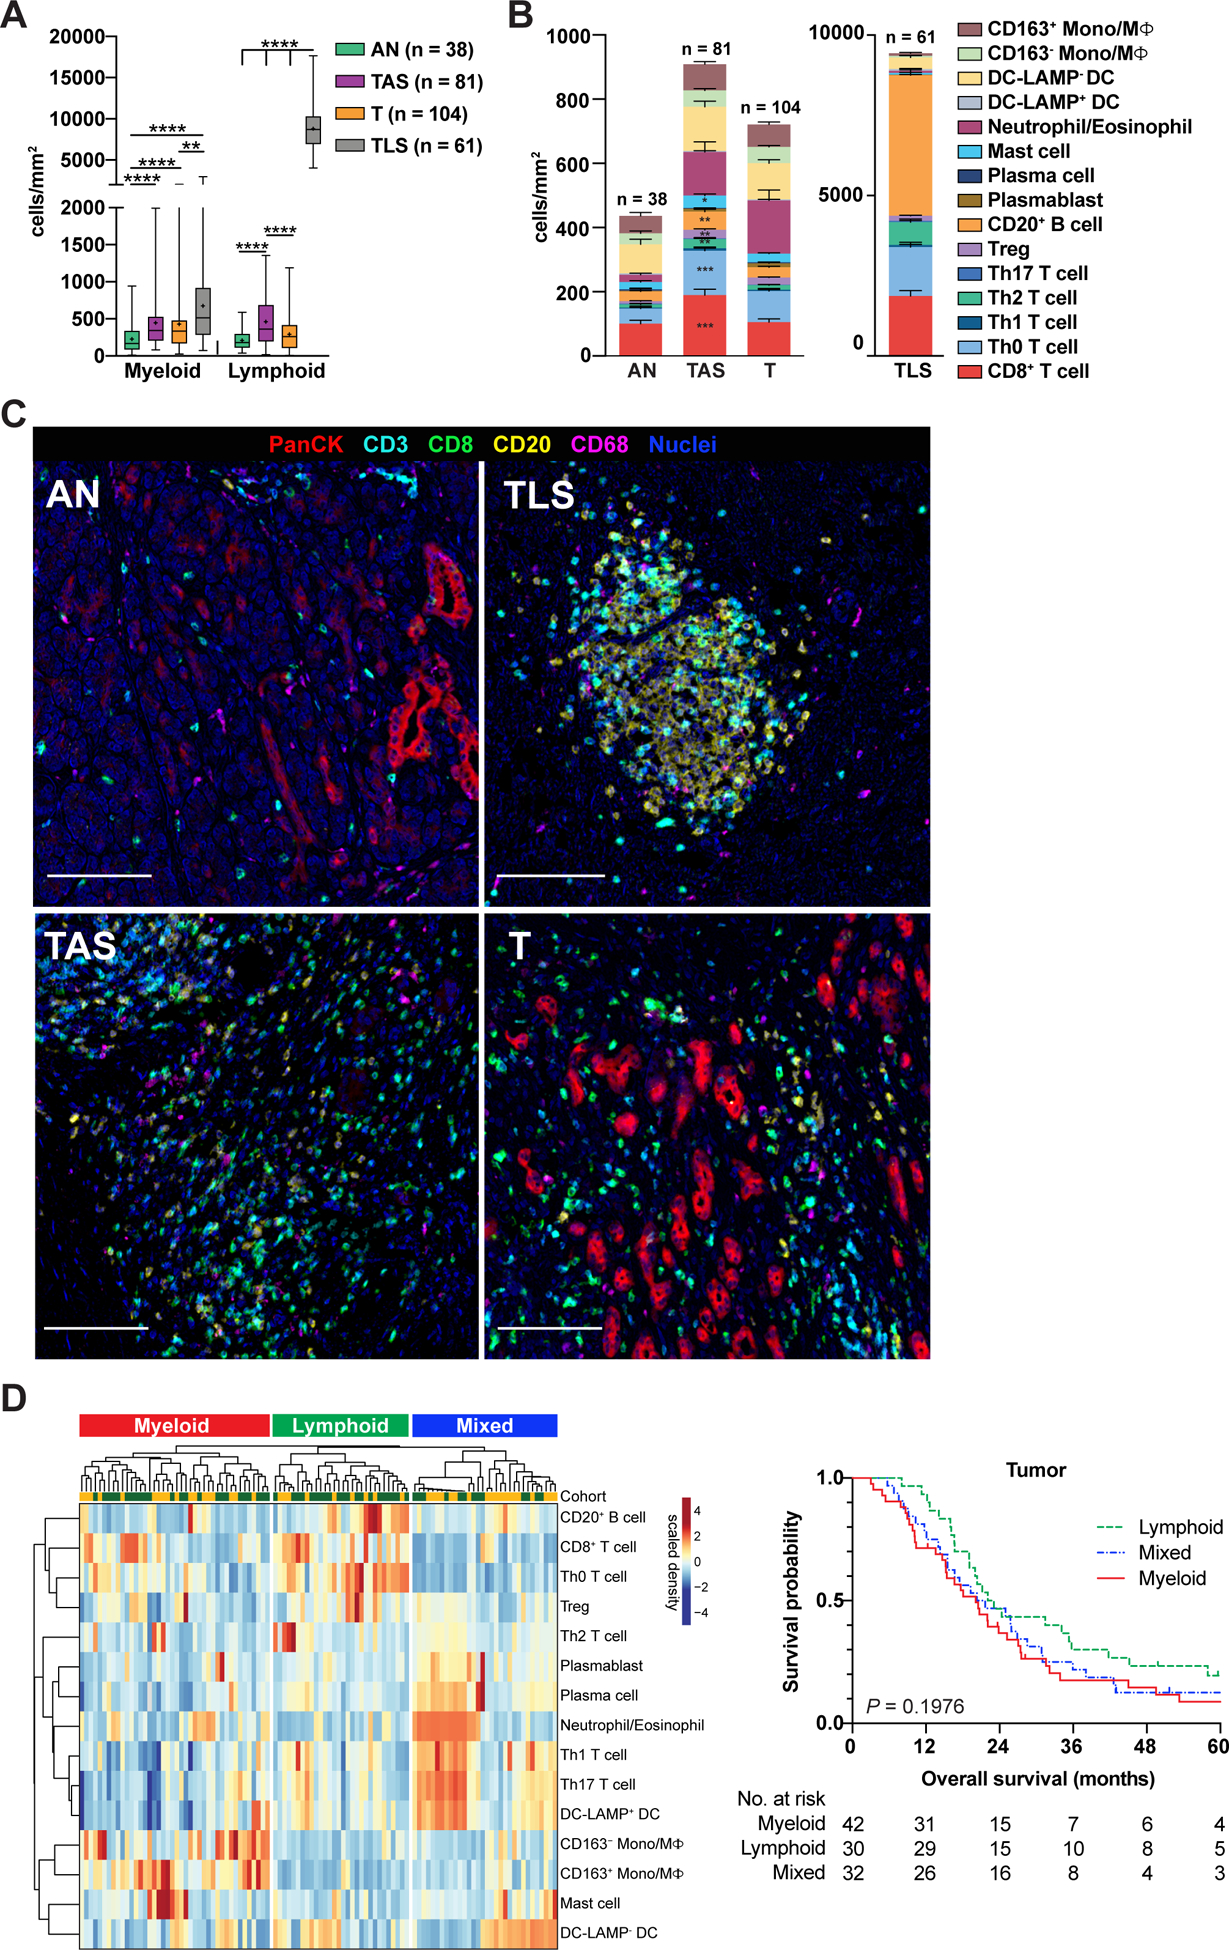
Figure 4. Regional characteristics of lymphoid and myeloid cell enrichment in PDAC.

(A) Myeloid and lymphoid cell densities within indicated regions of treatment-naïve PDAC samples from Cohorts 1 and 2. ‘Myeloid’ reflects cumulative densities of mast cells, neutrophils/eosinophils, DCs, and Mono/MΦ. ‘Lymphoid’ reflects cumulative densities of CD3+ T cells and B cells, including plasma cells and plasmablasts. Statistical differences were determined by mixed model repeated measures ANOVA on log-transformed data with heterogeneous compound symmetry (CSH) covariance structure to assess within-patient correlation. Tukey-Kramer post-hoc correction was applied, and adjusted P-values are reported. (B) Immune composition of PDAC regions from surgical resection specimens shown in ‘A’. A mixed effects model was used to determine differences in cell population densities in T versus TAS. Data represented as mean ± SEM. (C) Representative pseudocolored images of regions quantitated in ‘B’ depicting PanCK+, CD3+, CD8+, CD20+, and CD68+ cell types. Scale bars, 100 μm. (D) Unsupervised hierarchical clustering (left) of treatment-naive PDACs from Cohorts 1 (yellow, uppermost row) and 2 (green, uppermost row) showing relative enrichment of indicated leukocyte subsets (rows) in tumor (T) regions. Data is patient-scaled and immune population z-scored for visualization. Each column represents one patient (n = 104) and reflects multiple tumor ROIs per specimen. Kaplan-Meier curve (right) displaying OS of patients based on clusters; P-value determined by log-rank test.
