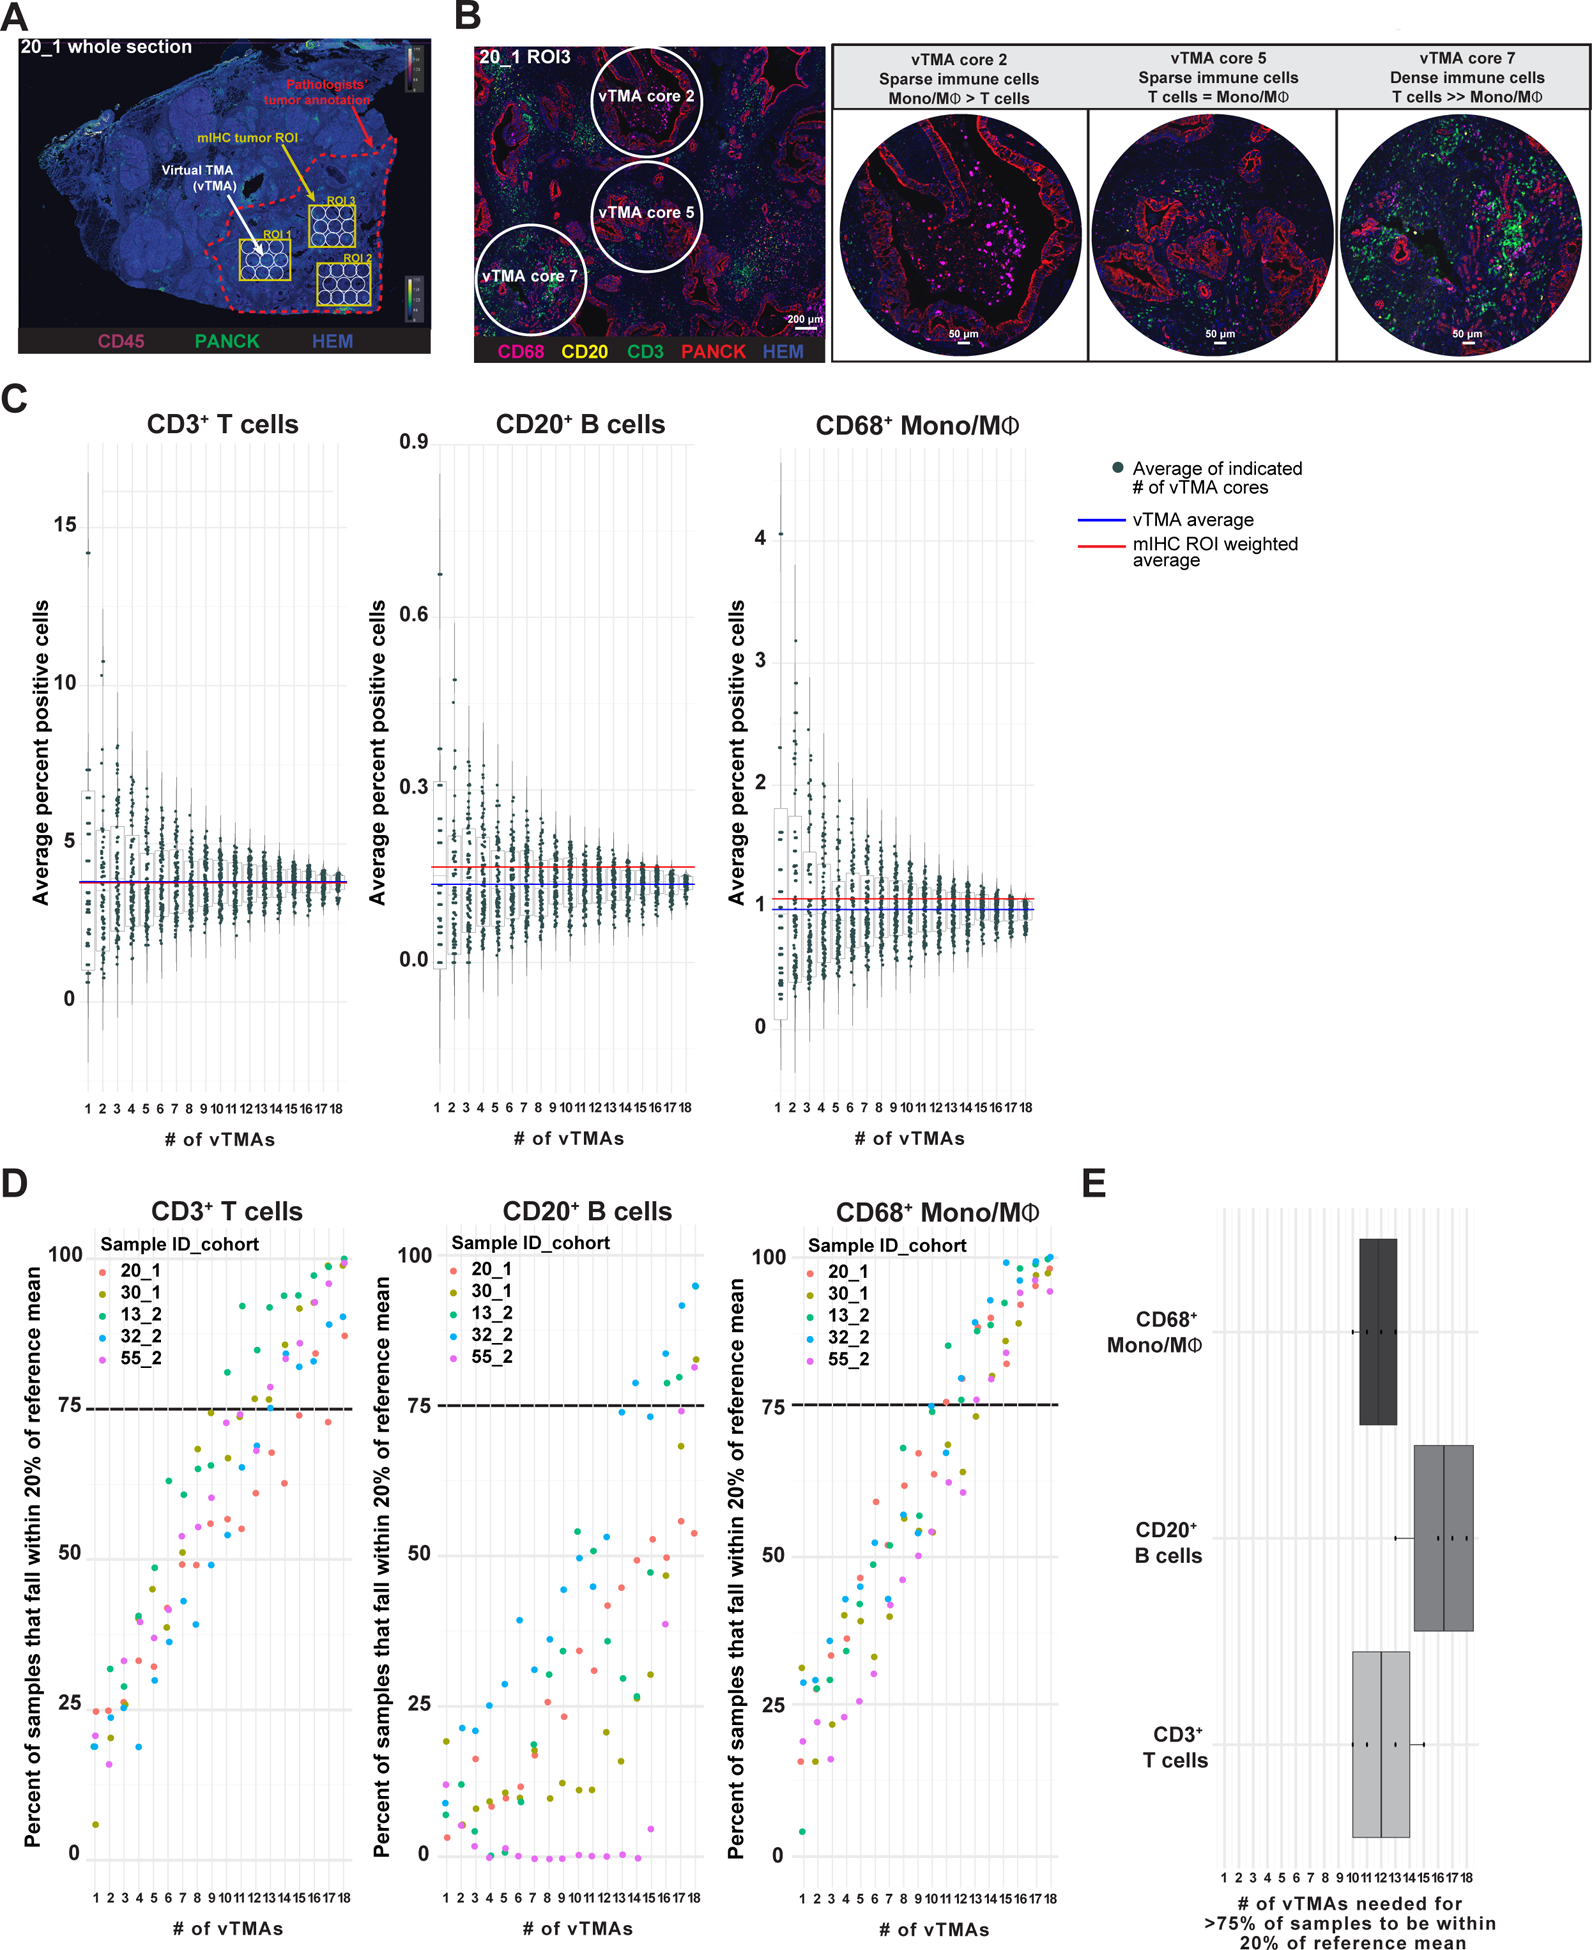
Figure 5. Intrapatient leukocyte heterogeneity in treatment-naïve PDACs.

(A) Representative pseudocolored image depicting PanCK, CD45, and hematoxylin (nuclei) mIHC from one PDAC specimen (Sample 20, Cohort 1) with overlays indicating pathologist’s tumor annotation (red dashed line), T ROIs used in mIHC quantitative analysis (yellow boxes), and vTMA cores (white circles). (B) Pseudocolored image showing CD68, CD20, CD3, PanCK, and nuclei immunostaining of ROI3 from Sample 20 Cohort 1 (20_1), highlighting vTMA cores 2, 5, and 7. Scale bar equals 200 μm (left). Higher magnification images of vTMA cores (right). (C) CD3+ T cell (left), CD20+ B cell (middle), and CD68+ monocyte/macrophage (right) cell frequencies calculated from the average of 1–18 vTMA cores (x-axis) for 100 sample iterations. The vTMA averages (blue lines, sample reference) and mIHC ROI weighted averages (red line) are shown. (D) Percent of data from vTMA sample iterations that falls within 20% of the reference mean (vTMA mean, blue line in panel C) for 1–18 vTMA cores for 3 cell types and 5 patients. A cutoff of 75% of vTMA derived data falling within 20% of the reference mean was chosen as a relative confidence measure and is highlighted with a black dotted line. (E) Number of vTMA cores required to achieve 75% confidence level described in panel D for indicated cell types.
