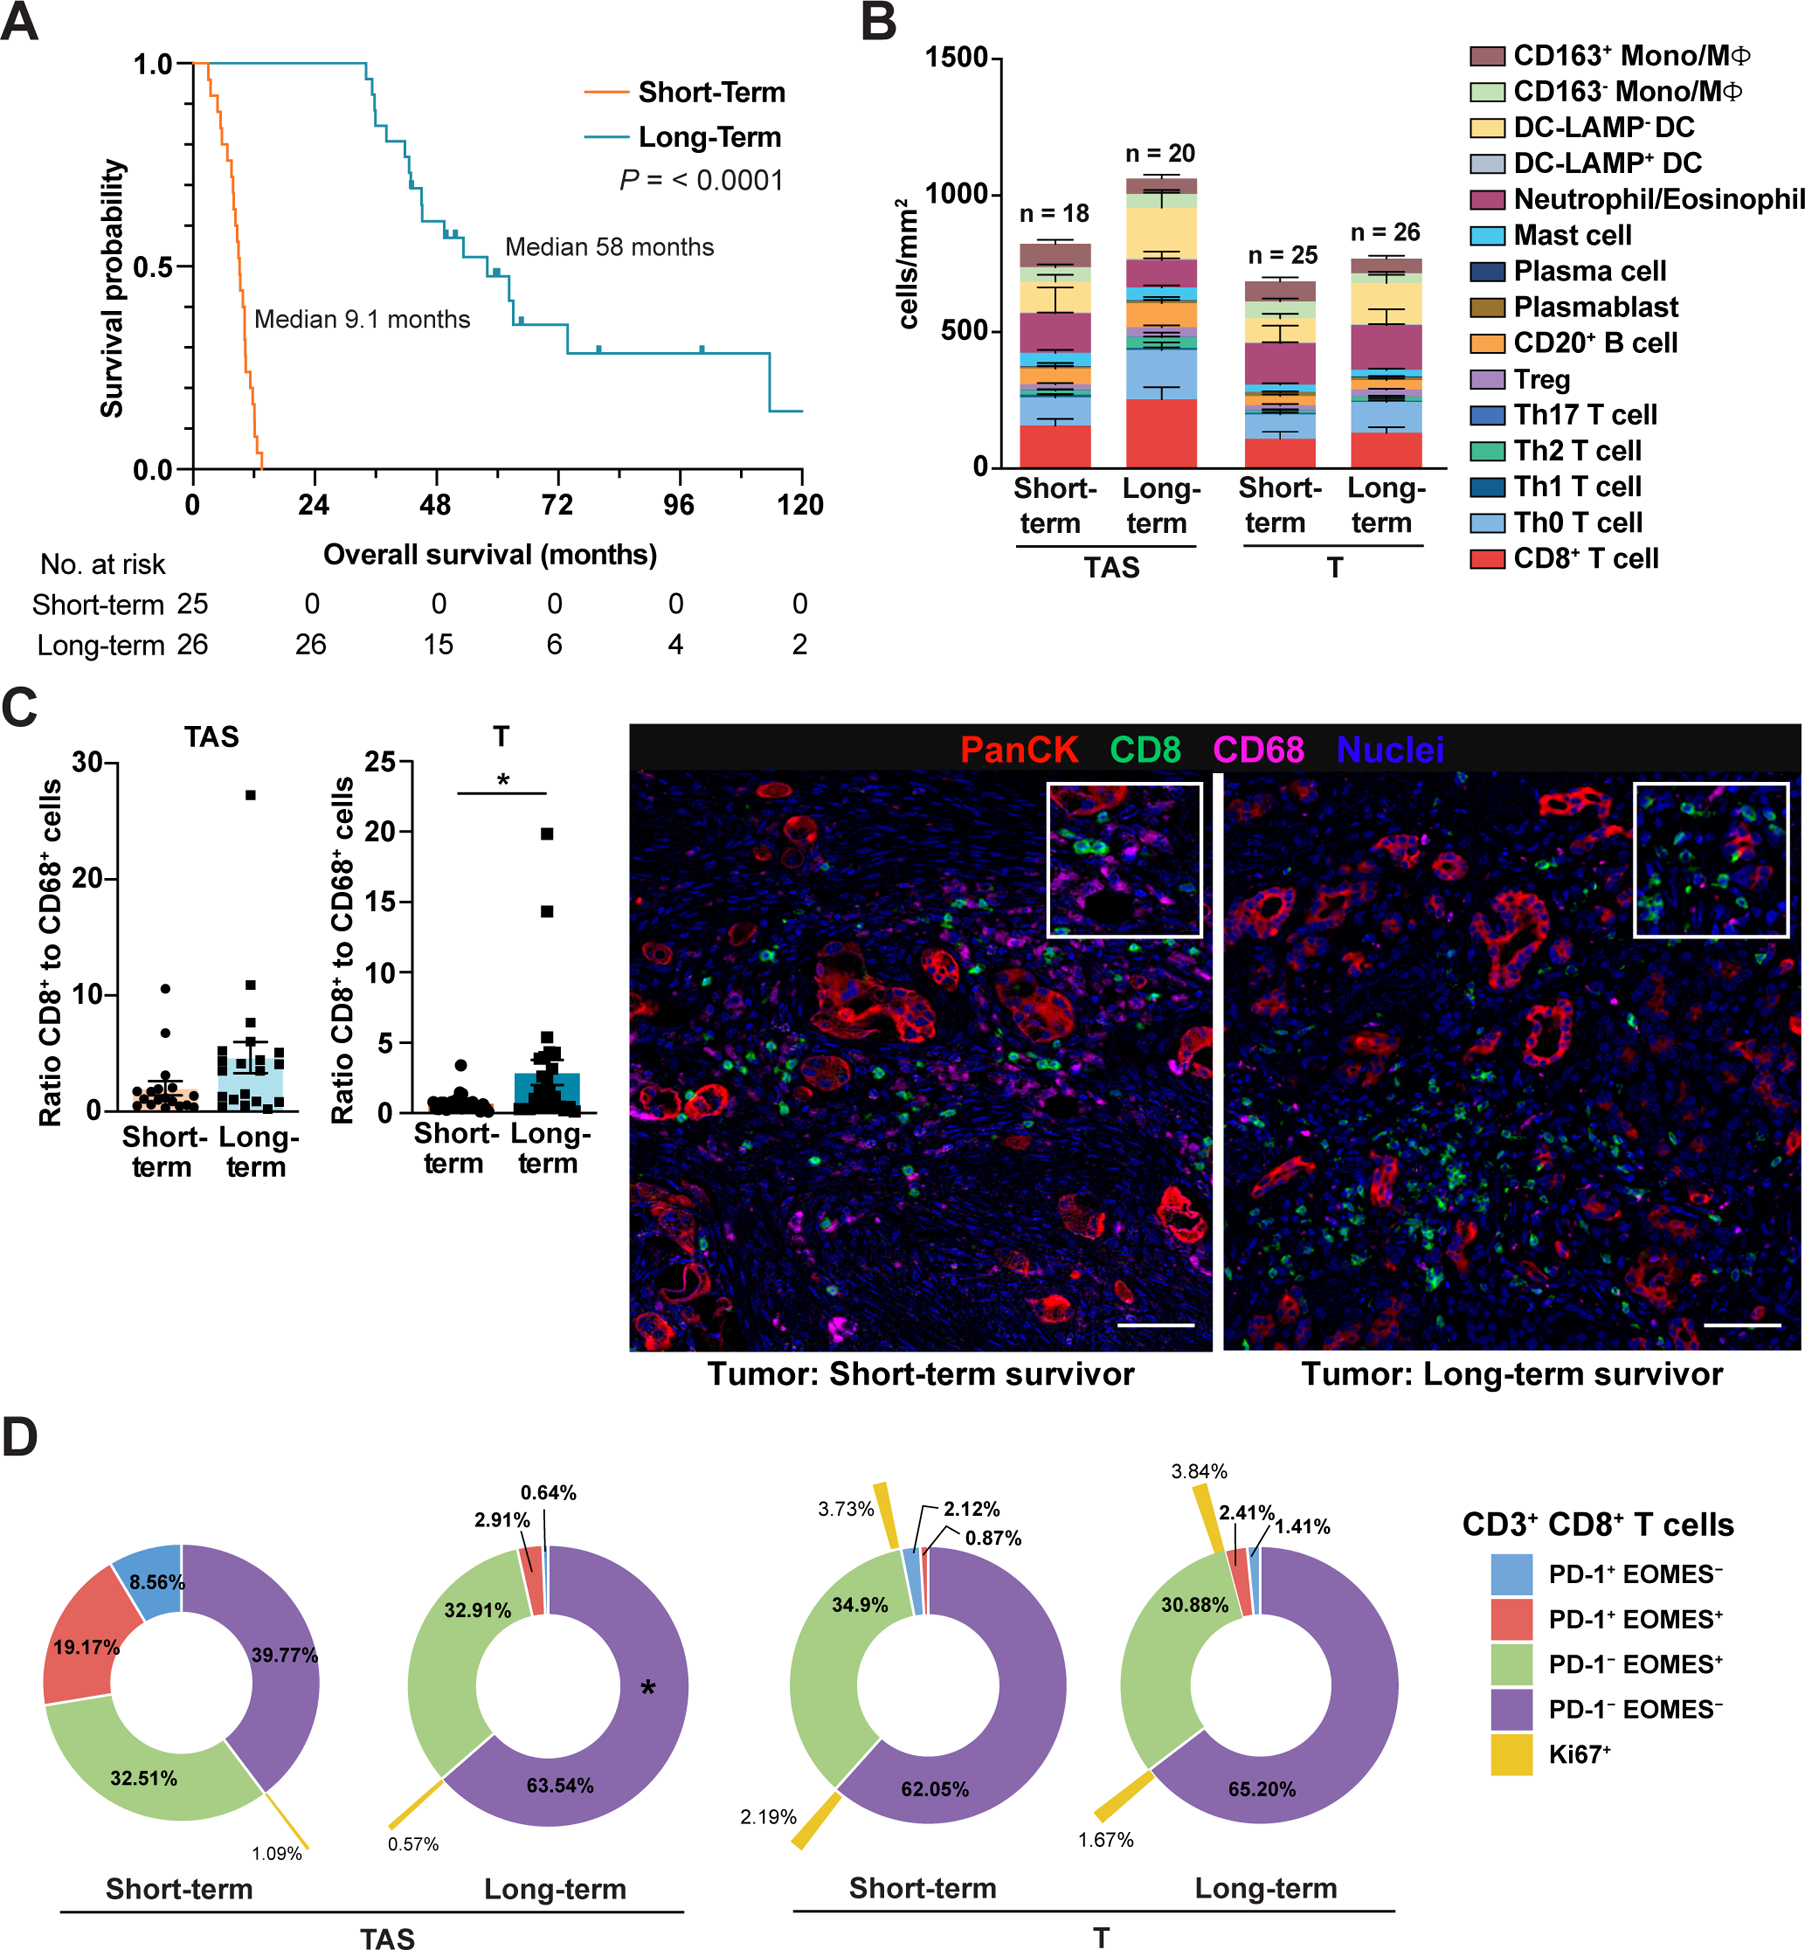
Figure 6. CD8+ T cell to CD68+ cell ratios correlate with clinical outcome.

(A) Kaplan-Meier curves displaying OS of treatment-naïve short-term (1st quartile OS time) and long-term (4th quartile OS time) survivors from Cohorts 1 and 2. P-value determined by log-rank test. (B) Leukocyte composition in T and patient-matched TAS from short-term and long-term survivors. Data are represented as mean ± SEM. (C) Ratio of CD8+ T cells to total CD68+ Mono/MΦ in T (short-term survivor, n = 25; long-term survivor, n = 26) and patient-matched TAS (short-term survivor, n = 18; long-term survivor, n = 20) with corresponding pseudocolored images from representative tumor areas. Each data point represents a single patient. Statistical differences were determined by Mann-Whitney U test. Scale bars, 50 μm. Boxed insets show higher magnification. (D) Sunburst plots of patients shown in panels ‘A-C’ depicting average frequency of CD3+CD8+ T cells within T and TAS exhibiting PD-1 and/or EOMES expression. Percentage of PD-1/EOMES subpopulations positive for Ki67 are indicated in outermost ring (yellow). Statistical differences in T cell subpopulations in short-term versus long-term survivors were evaluated by a mixed-effects model with Sidak’s multiple comparisons test.
