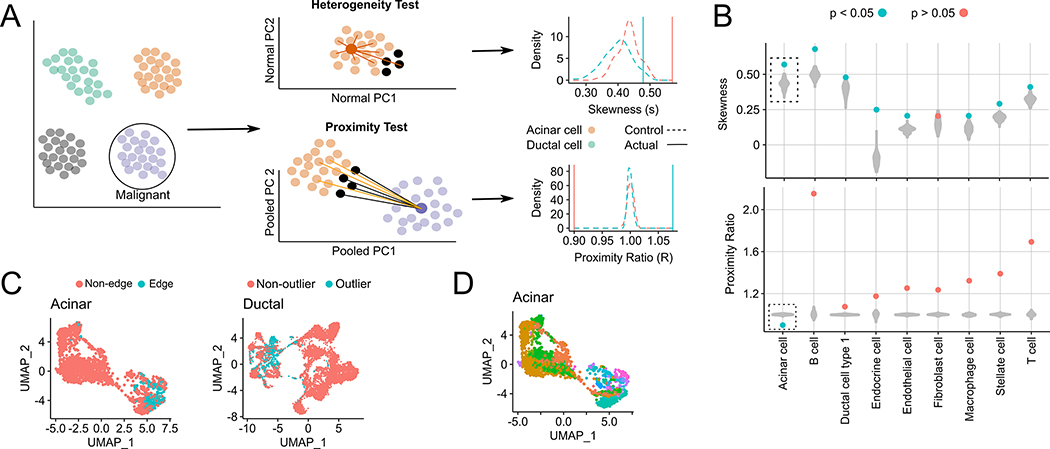
Fig. 1. Testing the presence of an edge sub-population among non-malignant cells in scRNA-seq data.
(A) Within each non-malignant cluster, every cell’s distance from the cluster medoid (in Normal PC space) is calculated, and the resulting distance distribution is tested for positive skewness. In the proximity test, we test if the 10% of non-malignant cells farthest from their own medoid (black, termed outlier cells) are significantly closer, in the Pooled PC space, to the malignant cluster medoid (dark purple) than the remaining 90% of cells (orange). If both test conditions hold, the outlier cells are called edge cells. For both tests, examples of the distributions of skewness and the proximity ratio are shown for acinar and ductal cells, as well as their respective control populations (B) Violin plots of medoid distance distribution skewness values (top) and malignant proximity ratio (bottom) after shuffling is performed 100 times for each indicated cluster. Filled circles indicate skewness and proximity ratio values of actual cells, where blue and red indicate a significant (< 0.05) or insignificant p-value for each test. (C) UMAP plots of edge and non-edge acinar cells (left) and non-outlier and outlier ductal cells (right). (D) UMAP plots of acinar cells colored by their sample of origin (34 samples in total, as acinar cells from one sample were discarded as they were likely doublets).

