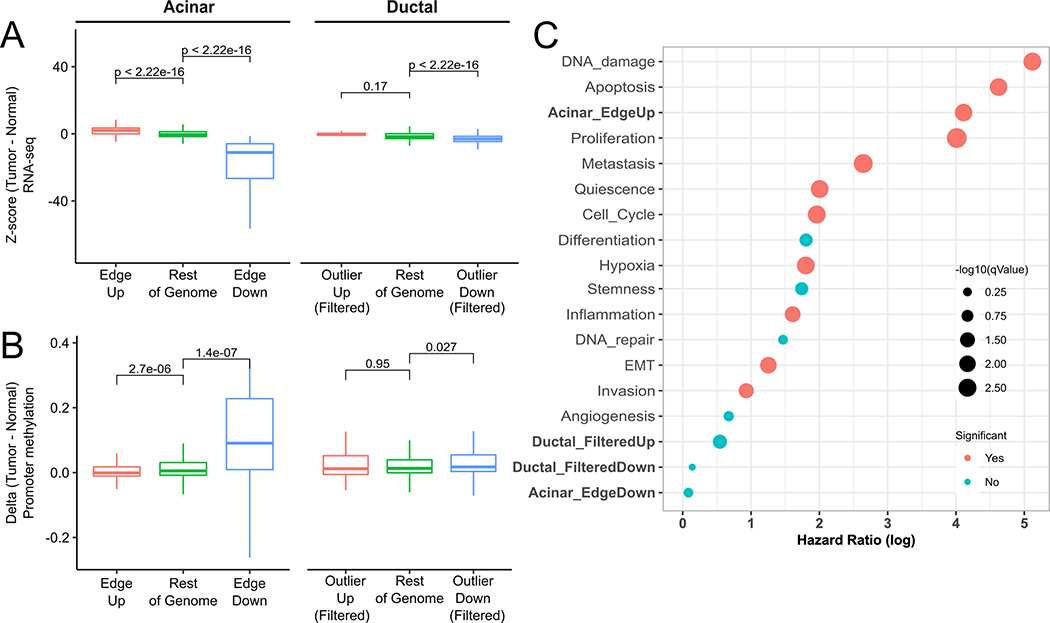
Fig. 3. Acinar Edge and Ductal Outlier genes in TCGA PDAC.
(A) RNA-seq expression z-scores in PDAC samples (using GTEx pancreas RNA-seq as a reference) of up-regulated (red), down-regulated (blue) and remaining (green) genes in edge-acinar cells and outlier-ductal cells. Genes in the Outlier-Up and Outlier-Down datasets are filtered to remove overlapping Edge-Up and Edge-Down genes. (B) Methylation z-scores among PDAC using methylation samples from healthy samples as a reference (see Methods) of gene promoters in A, (C) Log of Hazard ratios obtained from Cox regression of gene sets in TCGA PDAC samples.

