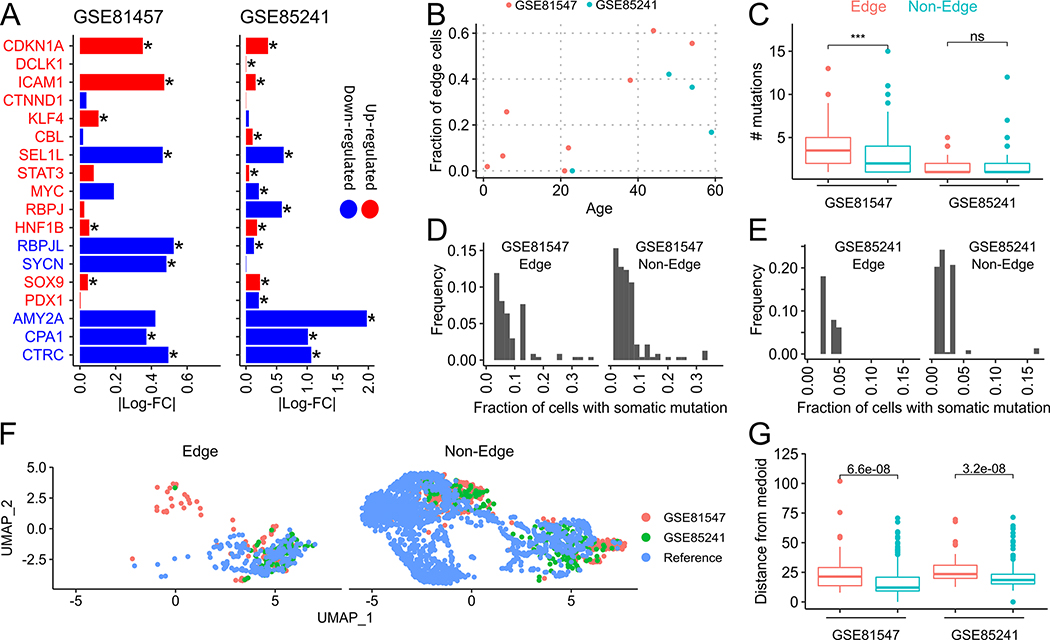
Fig. 4. Acinar edge cells in independent datasets and links with aging.
(A) Bars indicate log-fold changes between edge and non-edge acinar cells in GSE81547 and GSE85241. Markers in red and blue fonts are known to be up-regulated and down-regulated, respectively, during ADM (CDKN1A to STAT3) and dedifferentiation (MYC to CTRC). Matching color of the marker text and the bar indicates that the observed log-fold change matches the expected gene expression change of the marker. (B) Scatter plot of fraction of edge-acinar cells with tissue donor age. (C) Number of mutations in edge and non-edge acinar cells (D,E) Histogram of the fraction of edge and non-edge cells that contain a somatic mutation. (F) UMAP of acinar cells from GSE81547, GSE85241 and the reference dataset (Peng et. al) (G) Distance of edge (red) and non-edge (cyan) cells from the medoid acinar cell in PCA space computed separately for each dataset.

