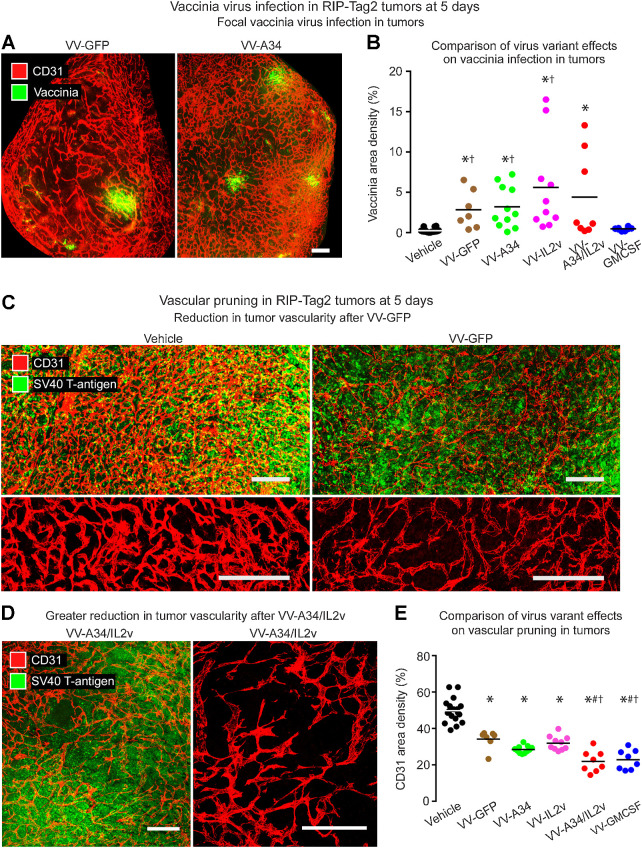
Figure 2.
Staining for vaccinia virus and vasculature in RIP-Tag2 tumors 5 days after i.v. injection of vaccinia virus variants. A, Fluorescence microscopic images of staining for vaccinia (green) and blood vessels (CD31, red) after VV-GFP (left) or VV-A34 (right). B, Mean area density of vaccinia for all tumors in each mouse. Vaccinia staining after reference virus VV-GFP (2.8%) or virus VV-A34 (3.2%) was similar to one another but greater than the control (Vehicle). Values after VV-IL2v (5.6%) and VV-A34/IL2v (4.4%) tended to be greater but were not significantly different from VV-GFP. However, values for VV-GFP, VV-A34, and VV-IL2v were greater than for VV-GMCSF (0.5%). Student's t test: P < 0.05 compared with vehicle* or VV-GMCSF†. C-D, Confocal microscopic images of vasculature (CD31, red) and tumor cells (SV40 T-antigen, green). C, Dense vasculature of control tumor (Vehicle) compared with pruned vasculature after VV-GFP, shown with tumor cells (low magnification, top) and vessels alone (higher magnification, bottom). D, Greater reduction in tumor vascularity after VV-A34/IL2v, where the sparse vasculature is shown with tumor cells (left) and alone (higher magnification, right). E, Measurements revealed reduced vascularity after all viruses and significantly lower values after VV-A34/IL2v or VV-GMCSF. ANOVA: P < 0.05 compared to vehicle*, VV-GFP#, or VV-IL2v†. Mice per group: Vehicle (N = 18), VV-GFP (N = 7), VV-A34 (N = 11), VV-IL2v (N = 10), VV-A34/IL2v (N = 8), VV-GMCSF (N = 8). Scale bar, 200 μm in all images.

