. 2021 May 27;20(8):1481–1494. doi: 10.1158/1535-7163.MCT-20-0863

Figure 3.

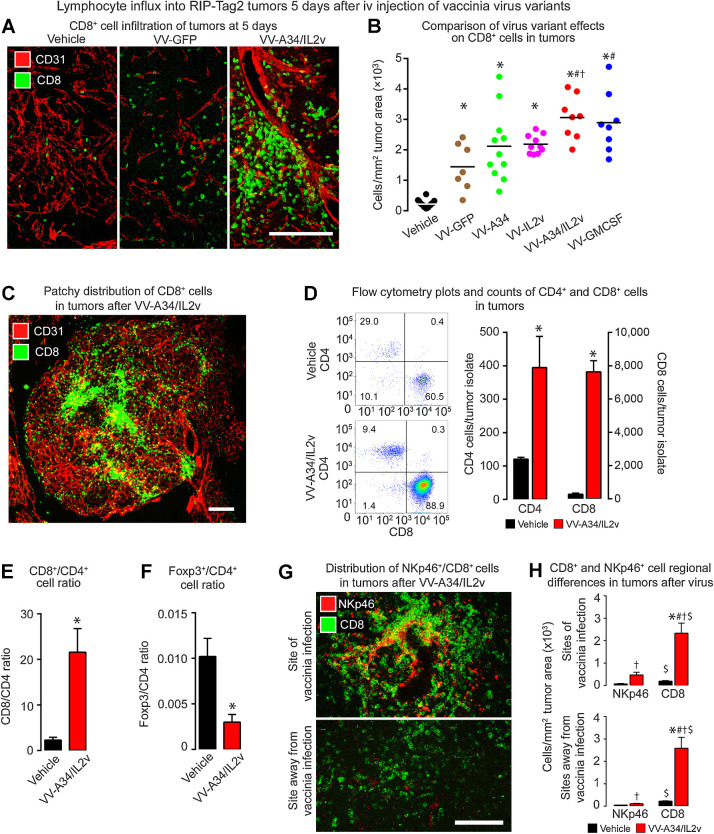
Figure 3. CD8+ T cells in RIP-Tag2 tumors 5 days after vaccinia virus variants. A, Confocal microscopic images show CD8+ cells (green) were sparse in the control (Vehicle), more numerous after reference virus VV-GFP, and even more abundant after virus VV-A34/IL2v. Blood vessels (CD31, red). B, CD8+ cell numerical densities show greater values after all viruses than after vehicle, and greater values after VV-A34/IL2v or VV-GMCSF than other viruses. ANOVA: P < 0.05 compared to vehicle*, VV-GFP#, or VV-IL2v†. Vehicle (N = 18), VV-GFP (N = 7), VV-A34 (N = 11), VV-IL2v (N = 10), VV-A34/IL2v (N = 8), VV-GMCSF (N = 8). C, Fluorescence microscopic image of CD8+ cell clusters (green) and blood vessels (CD31, red) after VV-A34/IL2v. D and E, Flow cytometry data compare CD4+ cells and CD8+ cells identified as the live cell fraction sorted as CD45+/CD19−/NK1.1−/CD11b−/TCRB+ cells from RIP-Tag2 tumors after vehicle or VV-A34/IL2v. D, Flow cytometry dot plots and bar graphs show increases in CD4+ cells and CD8+ cells after the virus, but CD8+ cells predominated. E, CD8+ cell/CD4+ cell ratios reflect the dominance of CD8+ cells after the virus. F, Foxp3+ cell/CD4+ cell ratios show the large decrease in proportion of Foxp3+ cells after the virus. Flow cytometry counts confirmed the small, unchanged number of Foxp3+ cells (1.3 ± 0.5 virus; 1.2 ± 0.2 vehicle) and increase in CD4+ cells (395 ± 93 virus*; 120 ± 6 vehicle) after the virus. Student's t test: P < 0.05 compared with vehicle*. N = 3 mice/group. G and H, CD8+ and NKp46+ cell distribution in tumors after vehicle or VV-A34/IL2v. G, Confocal microscopic images of CD8+ cells (green) and NKp46+ cells (red) in regions of infection (top) and without infection (bottom). H, CD8+ and NKp46+ cell numerical densities in the two regions. ANOVA: P < 0.05 compared with vehicle* (same cell type) and corresponding value for NKp46+ cells#. Student's t test: P < 0.05 compared with vehicle† and corresponding value for NKp46+ cells$. N = 5 mice/group. Scale bars, 200 μm in all images.

CD8+ T cells in RIP-Tag2 tumors 5 days after vaccinia virus variants. A, Confocal microscopic images show CD8+ cells (green) were sparse in the control (Vehicle), more numerous after reference virus VV-GFP, and even more abundant after virus VV-A34/IL2v. Blood vessels (CD31, red). B, CD8+ cell numerical densities show greater values after all viruses than after vehicle, and greater values after VV-A34/IL2v or VV-GMCSF than other viruses. ANOVA: P < 0.05 compared to vehicle*, VV-GFP#, or VV-IL2v. Vehicle (N = 18), VV-GFP (N = 7), VV-A34 (N = 11), VV-IL2v (N = 10), VV-A34/IL2v (N = 8), VV-GMCSF (N = 8). C, Fluorescence microscopic image of CD8+ cell clusters (green) and blood vessels (CD31, red) after VV-A34/IL2v. D and E, Flow cytometry data compare CD4+ cells and CD8+ cells identified as the live cell fraction sorted as CD45+/CD19/NK1.1/CD11b/TCRB+ cells from RIP-Tag2 tumors after vehicle or VV-A34/IL2v. D, Flow cytometry dot plots and bar graphs show increases in CD4+ cells and CD8+ cells after the virus, but CD8+ cells predominated. E, CD8+ cell/CD4+ cell ratios reflect the dominance of CD8+ cells after the virus. F, Foxp3+ cell/CD4+ cell ratios show the large decrease in proportion of Foxp3+ cells after the virus. Flow cytometry counts confirmed the small, unchanged number of Foxp3+ cells (1.3 ± 0.5 virus; 1.2 ± 0.2 vehicle) and increase in CD4+ cells (395 ± 93 virus*; 120 ± 6 vehicle) after the virus. Student's t test: P < 0.05 compared with vehicle*. N = 3 mice/group. G and H, CD8+ and NKp46+ cell distribution in tumors after vehicle or VV-A34/IL2v. G, Confocal microscopic images of CD8+ cells (green) and NKp46+ cells (red) in regions of infection (top) and without infection (bottom). H, CD8+ and NKp46+ cell numerical densities in the two regions. ANOVA: P < 0.05 compared with vehicle* (same cell type) and corresponding value for NKp46+ cells#. Student's t test: P < 0.05 compared with vehicle and corresponding value for NKp46+ cells$. N = 5 mice/group. Scale bars, 200 μm in all images.