. 2021 May 27;20(8):1481–1494. doi: 10.1158/1535-7163.MCT-20-0863

Figure 6.

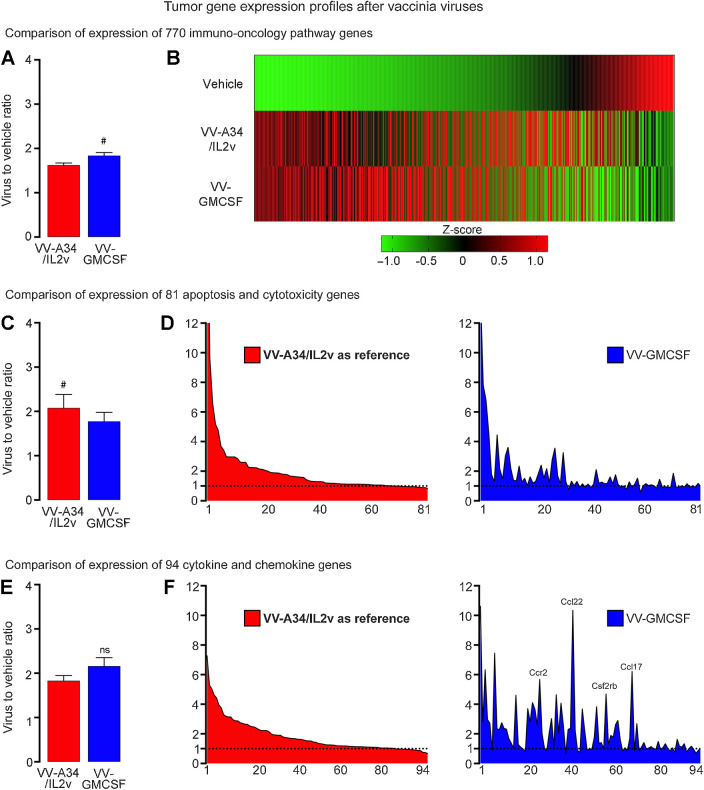
Figure 6. Gene expression profiles in RIP-Tag2 tumors 5 days after VV-A34/IL2v (red) or VV-GMCSF (blue) relative to vehicle. A and B, Expression of 770 immuno-oncology pathway genes after the two viruses compared as groups (A) and as heatmaps that show mean expression of genes converted into Z-scores (B). C and D, Expression of 81 apoptosis and cytotoxicity genes (Supplementary Table S3) compared as groups (C) and ranked from greatest to least ratio of VV-A34/IL2v to vehicle (D, left), with the same rank order used for the genes after VV-GMCSF (D, right). Value for granzyme A (Gzma) in D after VV-A34/IL2v (23.33) or VV-GMCSF (13.91) exceeded the y-axis maximum of 12 and is truncated. E and F, Expression of 94 cytokine, chemokine, and related genes (Supplementary Table S4) compared as groups (E) and ranked (F) as in C and D. High values for Ccr2, Ccl22, Csf2rb, and Ccl17 after VV-GMCSF are labeled (F, right). Wilcoxon signed-rank test: #, P < 0.05 for genes compared as groups. NS, not significant. Error bars show SEM. Vehicle (N = 5), VV-A34/IL2v (N = 5), 4 VV-GMCSF (N = 4). Horizontal dotted line marks value for vehicle group normalized to 1.0. Expression analyzed by NanoString Mouse PanCancer IO 360 Panel.

Gene expression profiles in RIP-Tag2 tumors 5 days after VV-A34/IL2v (red) or VV-GMCSF (blue) relative to vehicle. A and B, Expression of 770 immuno-oncology pathway genes after the two viruses compared as groups (A) and as heatmaps that show mean expression of genes converted into Z-scores (B). C and D, Expression of 81 apoptosis and cytotoxicity genes (Supplementary Table S3) compared as groups (C) and ranked from greatest to least ratio of VV-A34/IL2v to vehicle (D, left), with the same rank order used for the genes after VV-GMCSF (D, right). Value for granzyme A (Gzma) in D after VV-A34/IL2v (23.33) or VV-GMCSF (13.91) exceeded the y-axis maximum of 12 and is truncated. E and F, Expression of 94 cytokine, chemokine, and related genes (Supplementary Table S4) compared as groups (E) and ranked (F) as in C and D. High values for Ccr2, Ccl22, Csf2rb, and Ccl17 after VV-GMCSF are labeled (F, right). Wilcoxon signed-rank test: #, P < 0.05 for genes compared as groups. NS, not significant. Error bars show SEM. Vehicle (N = 5), VV-A34/IL2v (N = 5), 4 VV-GMCSF (N = 4). Horizontal dotted line marks value for vehicle group normalized to 1.0. Expression analyzed by NanoString Mouse PanCancer IO 360 Panel.