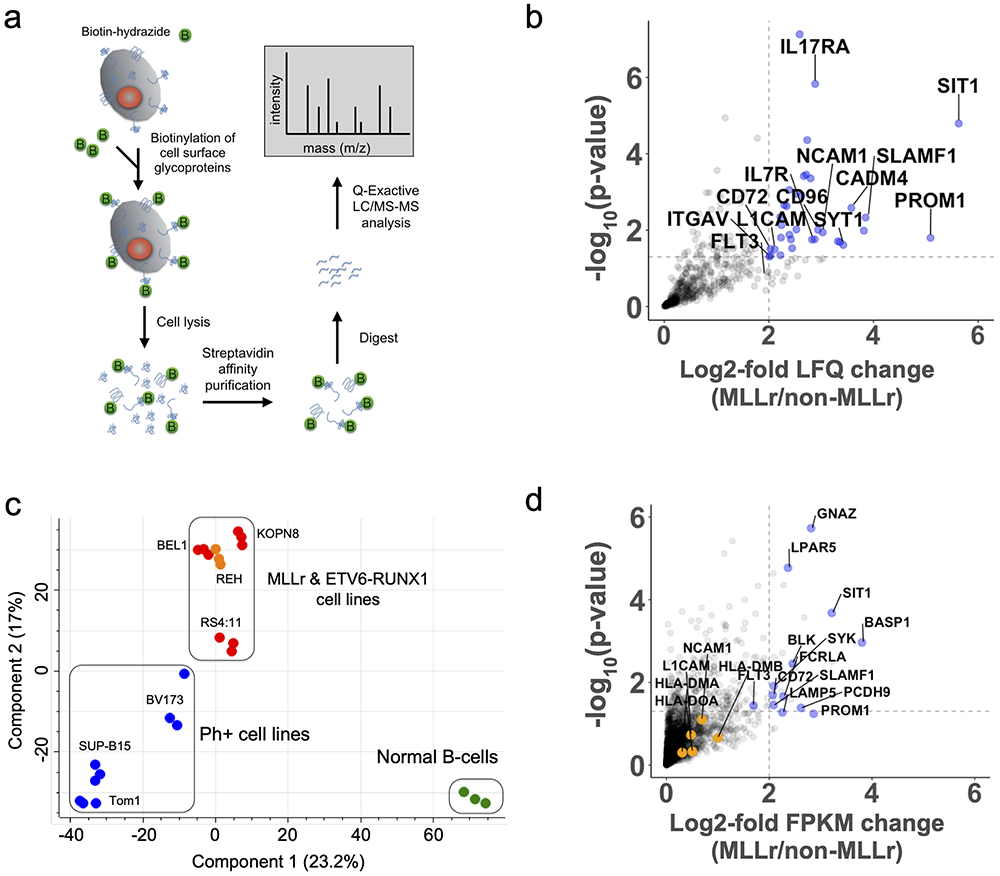
Figure 1: Multi-omics analysis of the MLLr B-ALL cell surfaceome uncovers unique cell surface signatures and survival dependencies.
(a) Proteomics workflow for quantifying the cell surfaceomes of B-ALL cell lines. (b) Volcano plot displaying MLLr upregulated cell surface proteins. The log2-fold change comparing the label-free quantification values (LFQ) of MLLr versus non-MLLr cell lines is plotted on the x-axis, while the −log10(p-value) is plotted on the y-axis. Proteins with log2-fold change > 2 and −log10(p-value) > 1.3 were considered significantly upregulated and are colored blue, with select proteins labeled. Significance and upregulation cut-offs are shown by dotted lines. Statistical analysis conducted using a two-sided Welch’s T-test. (c) Principal component analysis of the B-ALL cell surfaceome. Cell lines colored as follows: BCR-ABL, blue; MLLr, red; EBV B-cells, green; ETV6-RUNX1, orange. (d) Volcano plot displaying MLLr upregulated transcripts of cell surface proteins. The log2-fold change of the FPKM of different transcripts is shown on the x-axis while the −log10(p-value) is shown on the y-axis. Upregulated transcripts (log2-fold >2 and −log10(p-value) > 1.3) are shown in blue with select genes labeled. Genes identified through proteomics as up or down regulated, but were missed by transcriptome analysis are shown in orange and are labeled. Statistical analysis conducted using a two-sided Welch’s T-test. See also Supplementary Fig. S1 and S2.

