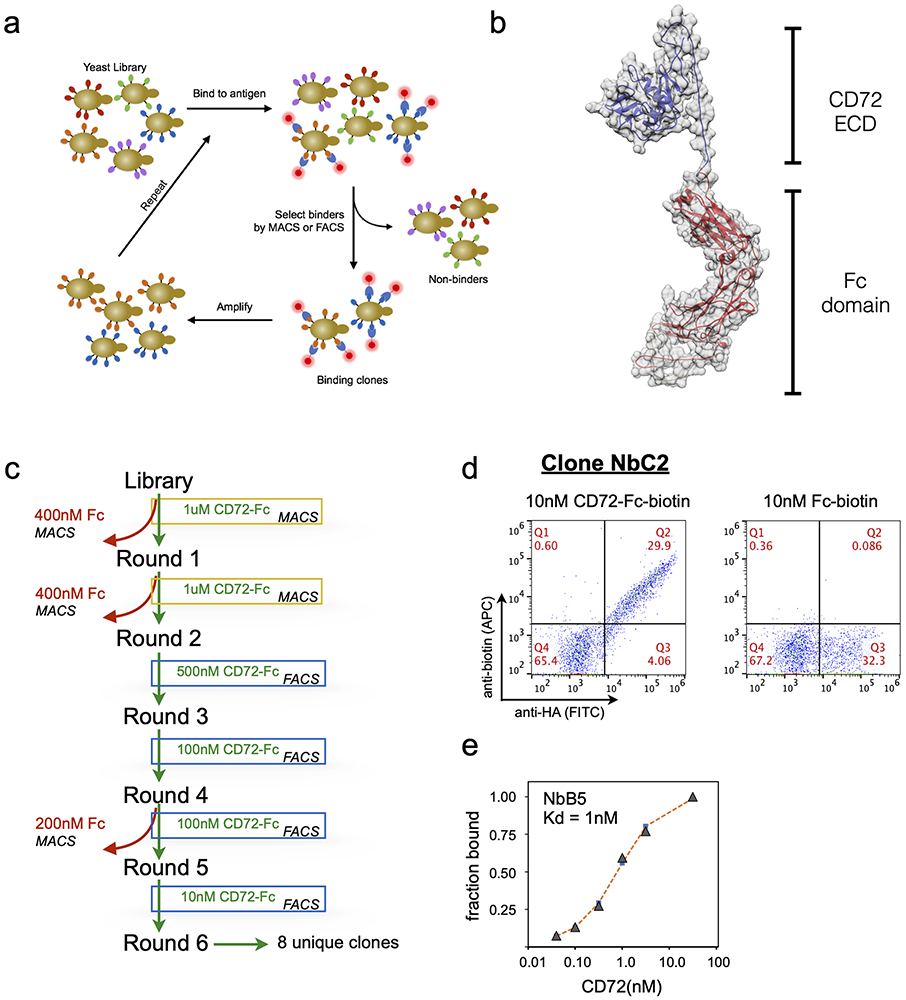
Figure 4: Isolation of high-affinity CD72 nanobodies with yeast display.
(a) Workflow for in vitro anti-CD72 nanobody selection using yeast display. (b) Structure model of recombinant CD72-Fc fusion used to perform yeast display selections. (c) Schematic displaying the nanobody yeast display selection strategy for each MACS and FACS selection round to enrich for CD72-specific nanobody binders. Two rounds of MACS followed by four rounds of FACS with decreasing concentration of CD72 antigen produced high affinity anti-CD72 nanobodies (d) Flow cytometry plots of yeast clone NbC2 binding to 10nM CD72-ECD-Fc protein (left) or 10nM Fc protein (right). Y-axis displays the anti-biotin-APC signal (corresponding to yeast binding to recombinant protein) and the x-axis displays the anti-HA-FITC signal (corresponding to nanobodies displayed on the yeast surface). (e) Representative plot of on-yeast binding of recombinant CD72-Fc fusion protein for CD72-selected nanobody clone NbB5 expressed on yeast to determine estimated binding affinities. KD determined by curve fitting using non-linear least squares regression.

