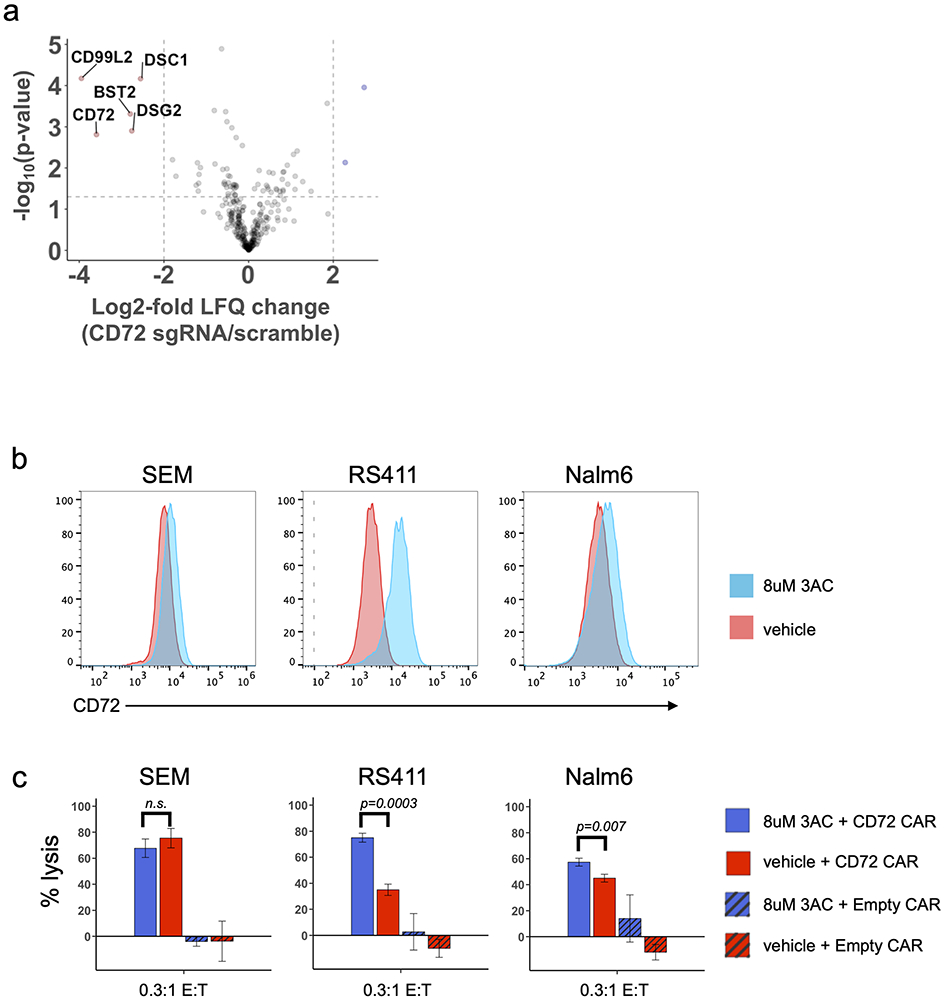
Figure 7: Modulating the B-ALL surfaceome after CD72 antigen escape and increasing CD72 antigen density with SHIP1 inhibition.
(a) Volcano plot displaying differentially regulated cell surface proteins dependent on CD72-knockdown. The log2-fold change comparing the label-free quantification values (LFQ) of RS411-CD72 knockdown versus RS411-scramble cell lines is shown on the x-axis, while the −log10(p-value) is shown on the y-axis. Proteins with log2-fold change < −2 and p < 0.05 were considered significantly downregulated and are colored red. Significance cut-offs are shown by dotted lines. Statistical analysis was conducted using a two-sided Welch’s T-test. (b) Change in CD72 surface density on three B-ALL cell lines after 72 hours of 3AC treatment (8 μM). (c) CAR-T cytotoxicity of three B-ALL cell lines pre-treated with either 3AC (8 μM) or vehicle for 72 hours. Drug was washed out of B-ALL cell lines prior to incubation with either CD72 CAR-T or Empty CAR-T for 24 hours, at 0.3:1 E:T ratio. All target cells stably expressed enhanced-firefly luciferase to enable viability measurements with bioluminescence imaging using D-luciferin. Experiments were performed in triplicate and signals were normalized to control wells containing only target cells. Data is represented as mean +/− SEM. Significance determined using a two-sided t-test. See also Supplementary Fig. S8.

