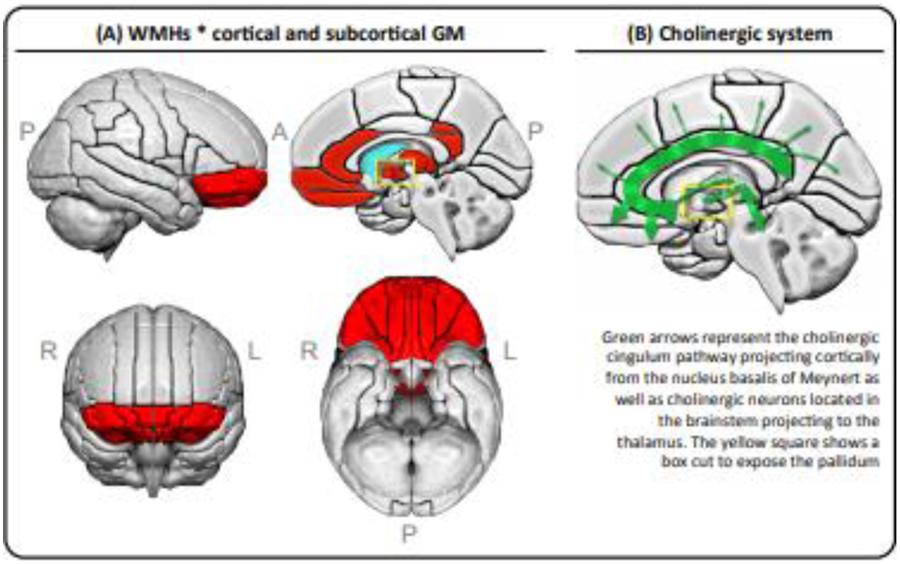
Figure 5. The association of WMHs with cortical thickness and subcortical gray matter volumes.
(A) Red areas represent combined results from two models: the cluster of cortical regions with the highest estimates from a linear mixed effects model with WMHs as a fixed effect variable and center as a random variable, adjusted for age and sex; plus all the significant regions from a linear mixed effects model for subcortical volume ROIs with WMHs as a fixed effect variable and center as a random variable, adjusted for age, sex, and total intracranial volume (please see Supplementary Figure 1 for forest plot results including estimates, confidence intervals, and both uncorrected and FDR-adjusted p-values). (B) A schematic representation of the cholinergic system. Abbreviations: A = anterior; FDR = False Discovery Rate; GM = gray matter; L = left; P = posterior; R = right; WMHs = white matter hyperintensities.

