
Figure 1.
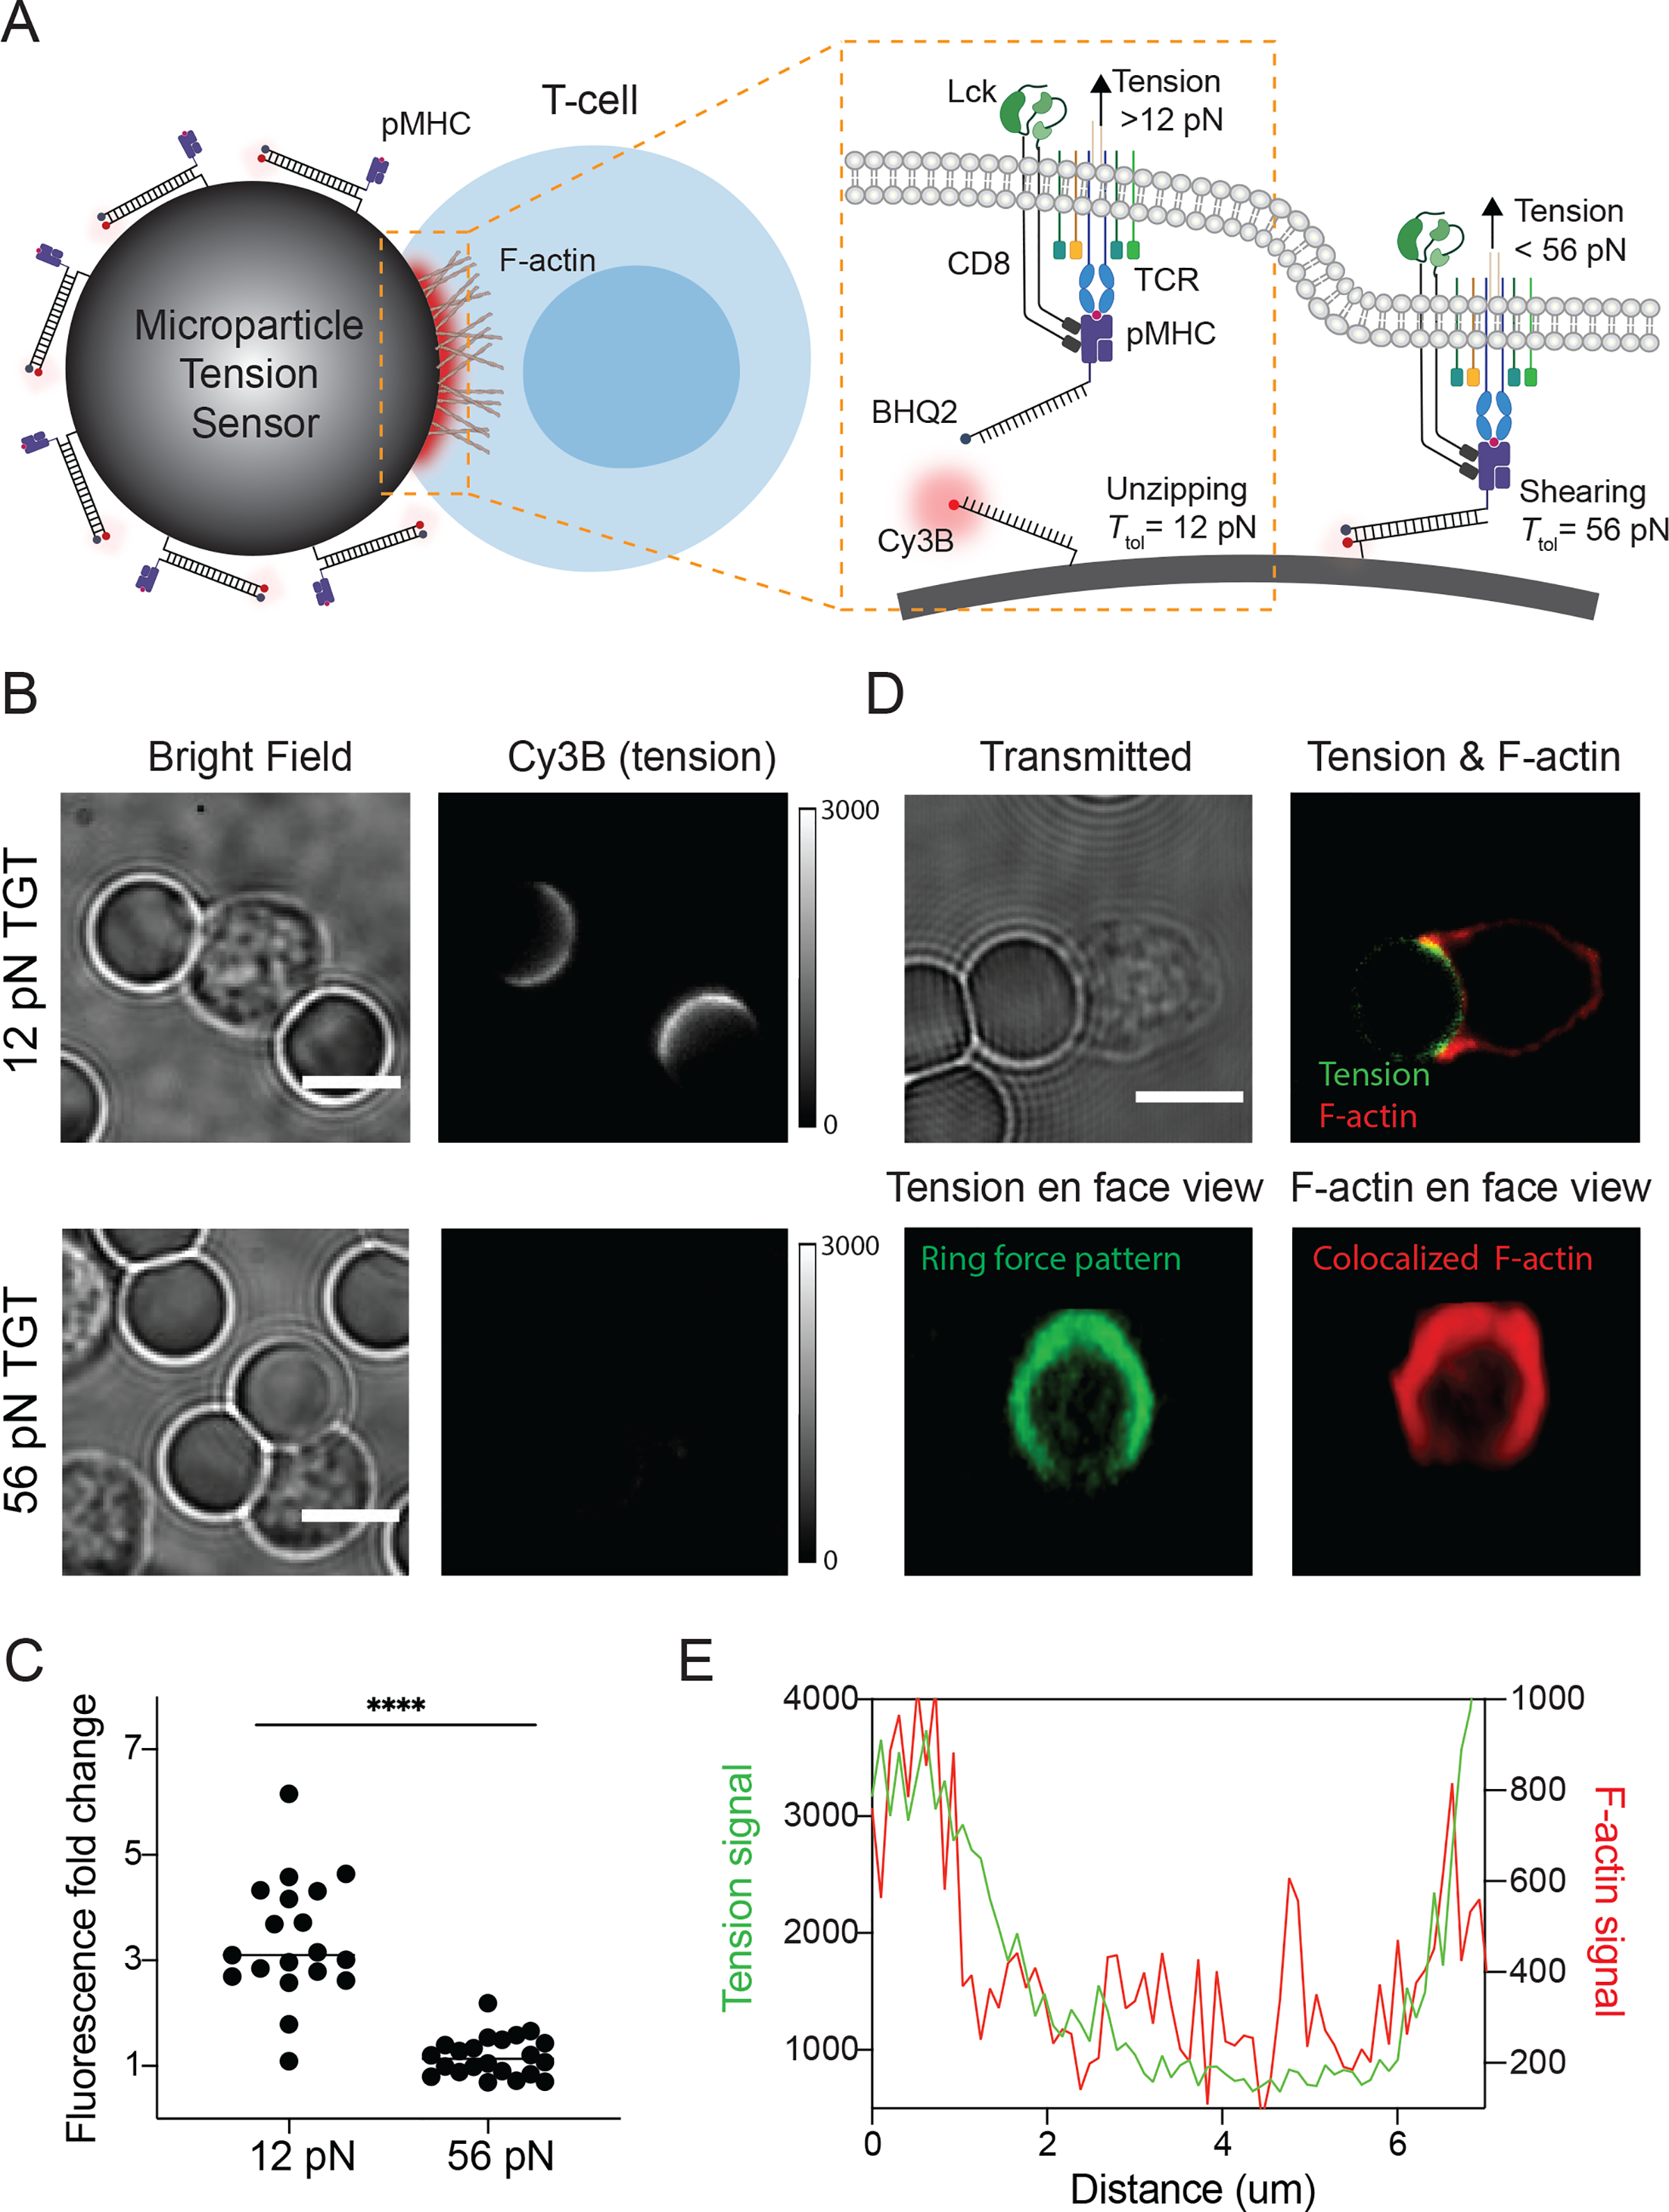
Mechano-imaging of TCR forces on spherical surfaces. (A) Schematic of μTS for mapping TCR forces transmitted through TCR-pMHC bonds at cell-μTS junctions. (B) Representative bright field and Cy3B fluorescence images showing adhesion and tension signals localized at junctions between T-cells and 12 pN μTS. (C) Plot showing fluorescence intensity fold change of junctions on μTS compared to background. Each dot represents single junctions from 3 different animals in independent experiments. **** indicates p<0.0001. (D) Representative confocal images showing ring-like tension signal (green) and F-actin signal (red) at T-cell-μTS synapse. (E) Linescans of F-actin signal (red line) and tension signal (green line) at the interface from junction shown in D. Scale bars = 5 μm.