
Figure 4.
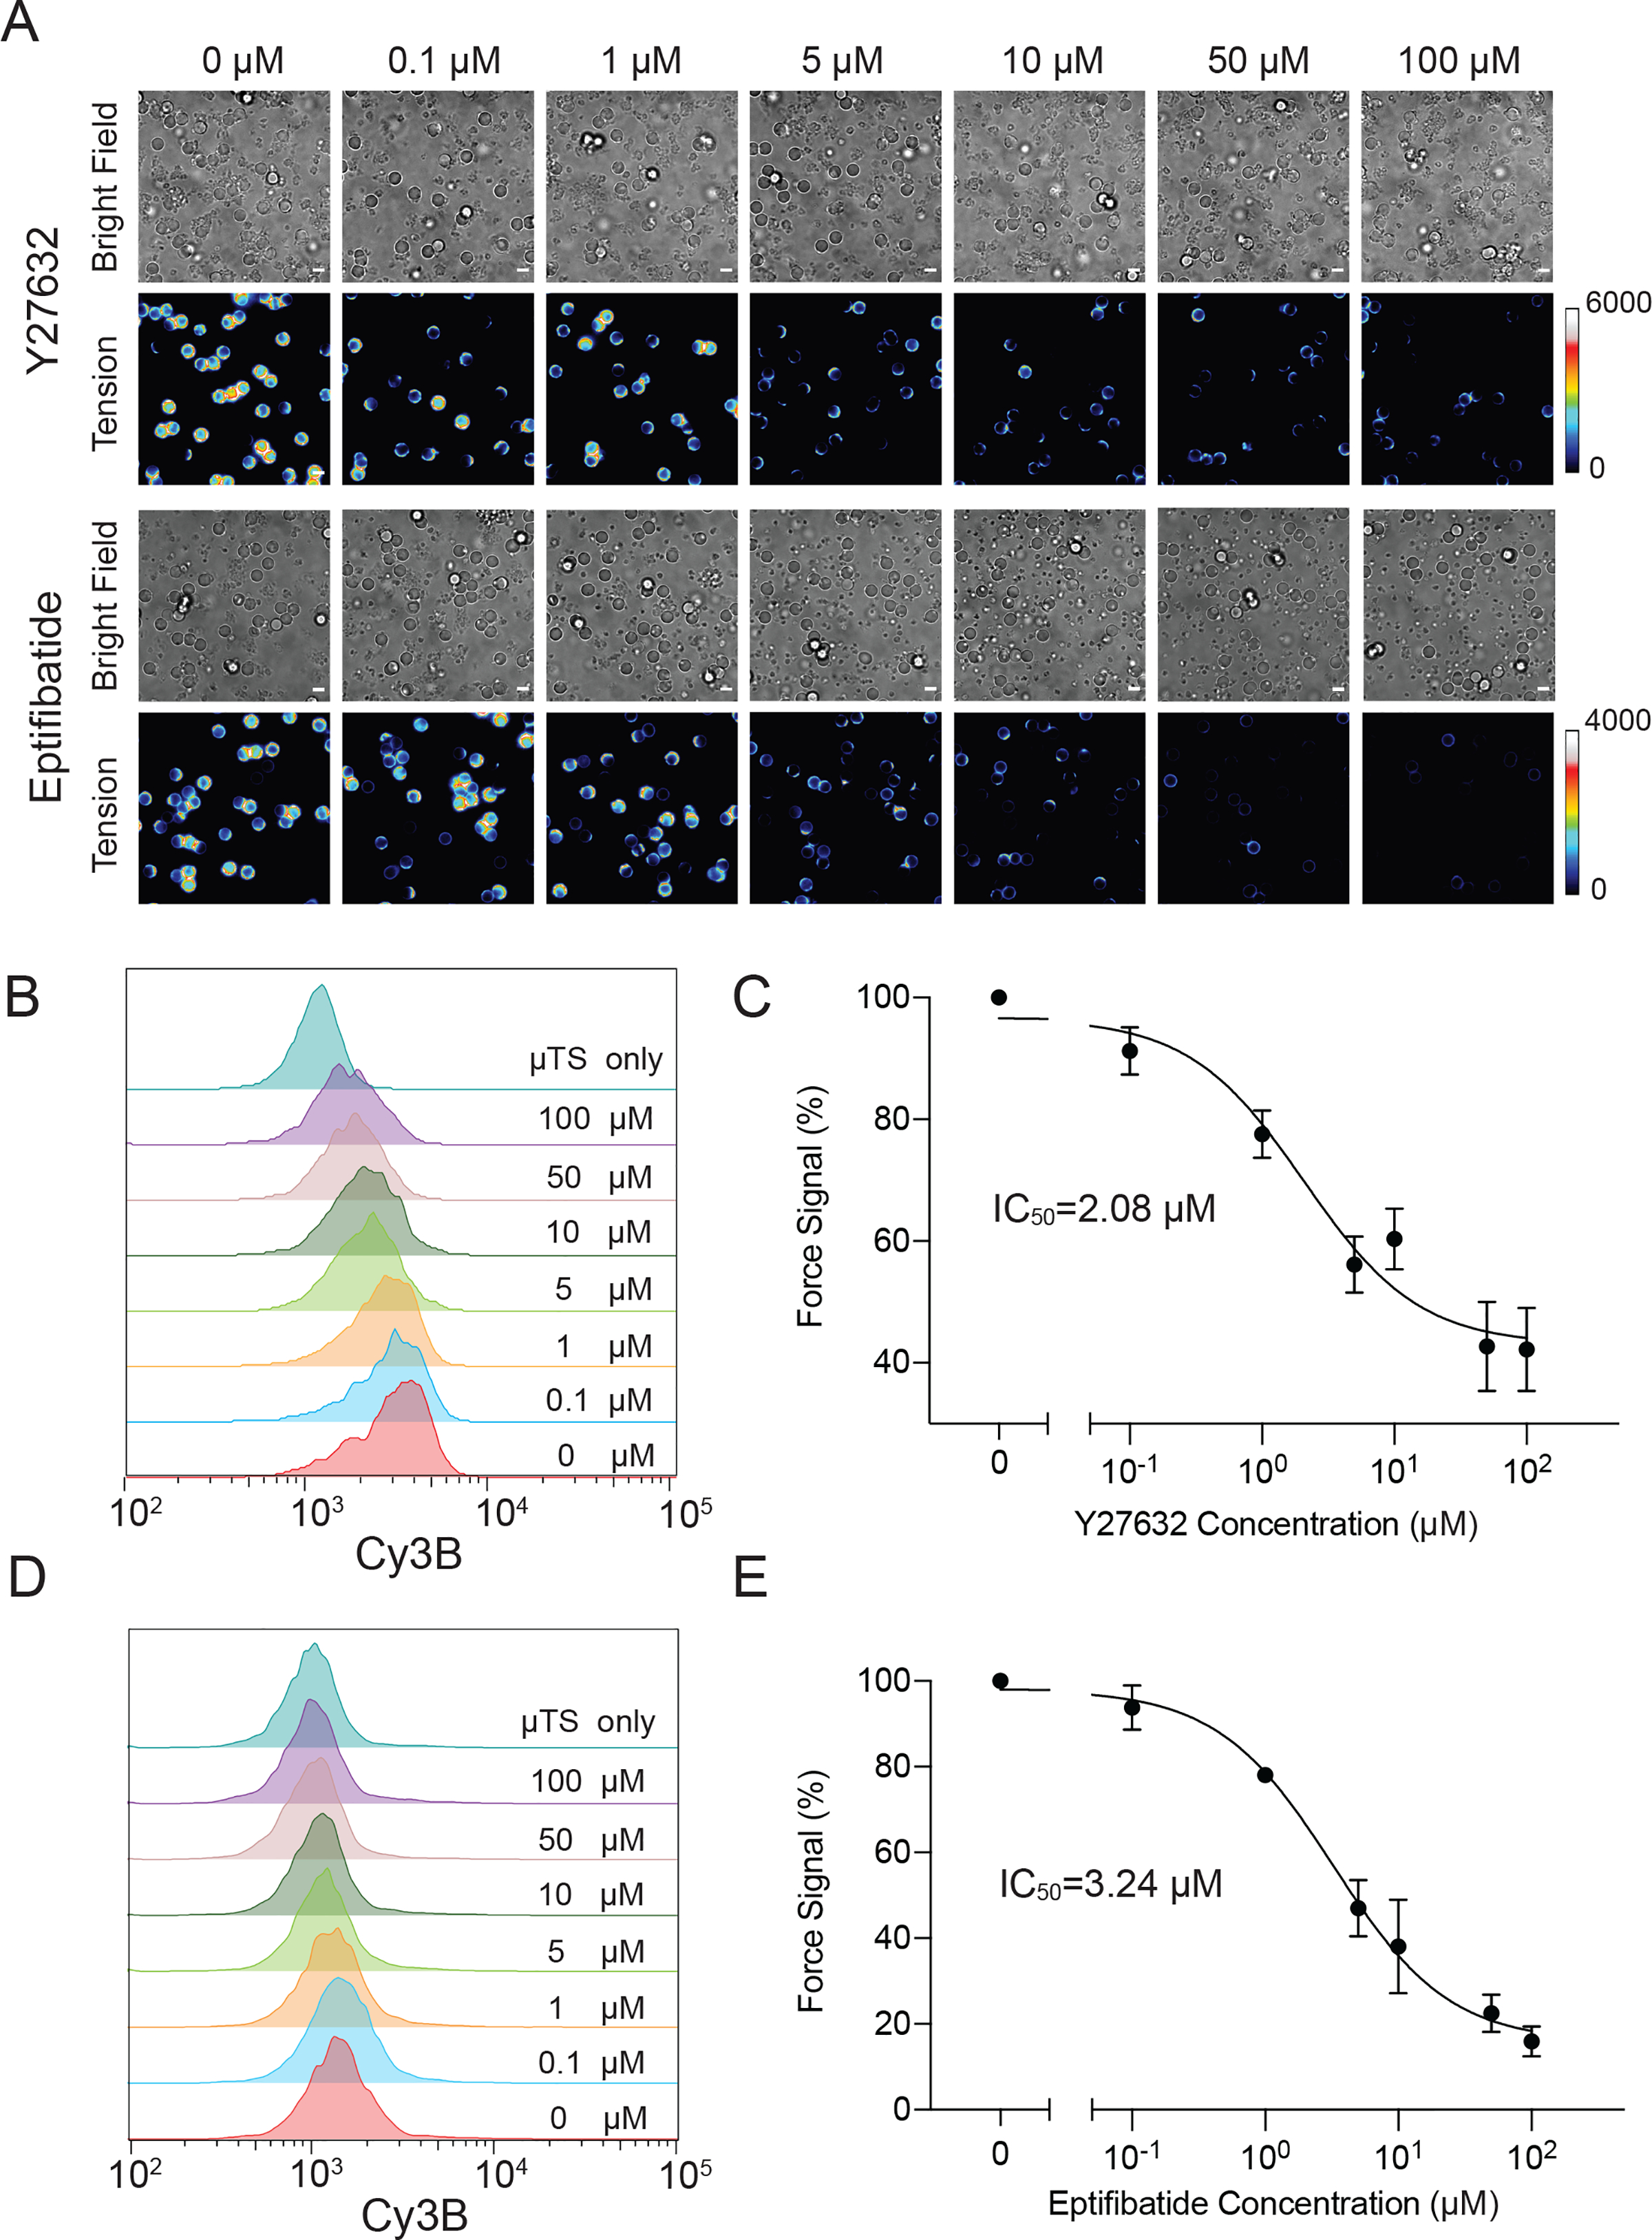
Proof-of-concept demonstration of measuring dose-response curve for drugs that modulate platelet mechanics. (A) Representative bright field and fluorescence images showing a mixture of platelets with μTS probes that were allowed to interact for 1 hr and then seeded on a substrate. Platelets were pretreated with a range of concentrations of Y27632 and eptifibatide (0–100μM) for 20 min. (B) Flow-cytometry based histograms of fluorescence intensity of μTS that engaged platelets treated with different concentrations of Y27632. (C) Dose-response curve plotting the tension signal obtained from flow cytometry plotted against the log concentration of Y27632. (D) Flow-cytometry based histograms of fluorescence intensity of μTS probes that engaged platelets pretreated with different concentrations of eptifibatide. (E) Dose-response curve plotting the tension signal obtained from flow cytometry against the log concentration of eptifibatide. Each histogram is plotting N = 10000 events. Error bars show the standard error of the mean from three independent measurements from three animals. Scale bars = 5 μm