. 2021 May 21;14(8):767–778. doi: 10.1158/1940-6207.CAPR-20-0607

Figure 2.

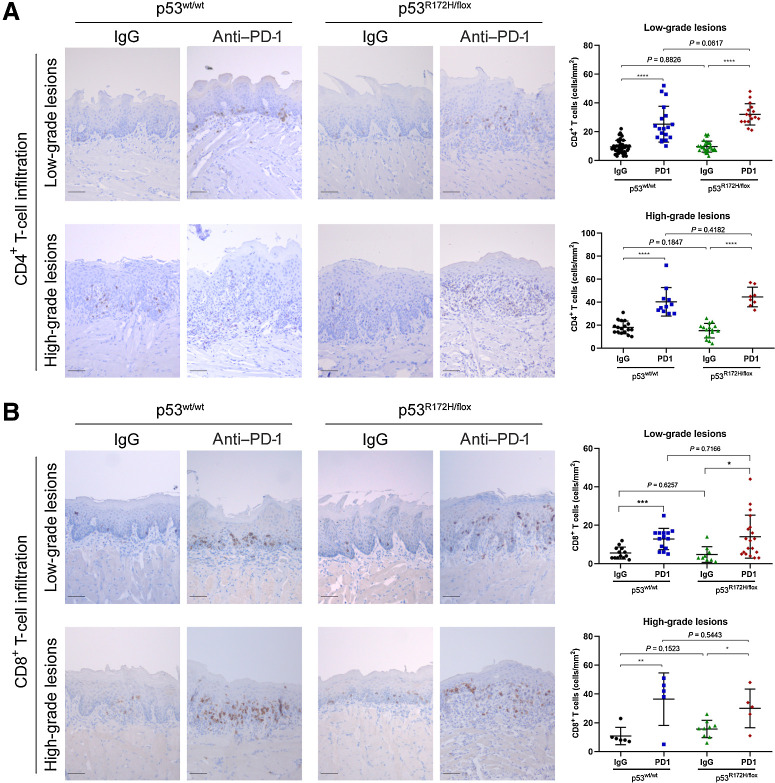
Figure 2. Increased infiltration of CD4+ and CD8+ T cells in oral lesions after anti–PD-1 treatment. A, Representative images of low- and high-grade oral lesions and IHC quantification signal of CD4+ T cells (right side graphs). B, Representative IHC images of infiltrating CD8+ T cells in oral lesions. A significant difference of CD4+ and CD8+ T cells was detected between untreated and PD-1 treated mice groups. Immunostaining signal was defined as the number of positive cells per mm2. Right graphs: *, P < 0.05; **, P <0.01; ***, P <0.001; ****, P < 0.0001. Scale bar, 50 μm.

Increased infiltration of CD4+ and CD8+ T cells in oral lesions after anti–PD-1 treatment. A, Representative images of low- and high-grade oral lesions and IHC quantification signal of CD4+ T cells (right side graphs). B, Representative IHC images of infiltrating CD8+ T cells in oral lesions. A significant difference of CD4+ and CD8+ T cells was detected between untreated and PD-1 treated mice groups. Immunostaining signal was defined as the number of positive cells per mm2. Right graphs: *, P < 0.05; **, P <0.01; ***, P <0.001; ****, P < 0.0001. Scale bar, 50 μm.