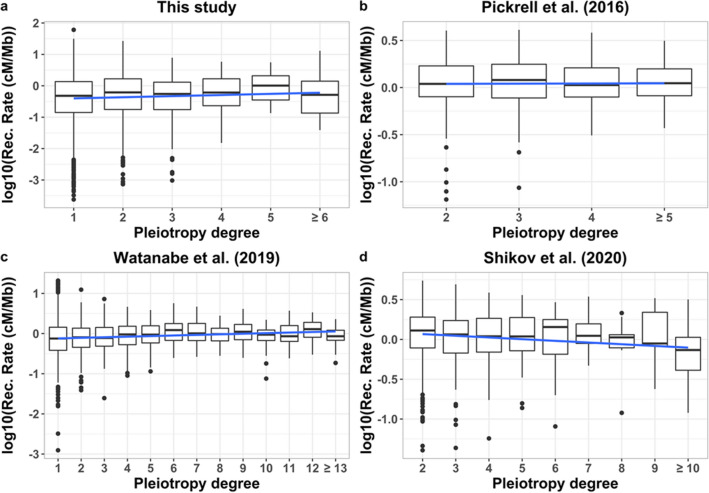
Fig. 2.
Relationship between the recombination rate (RR in log10[cM/Mb]) of each variant genomic position and the degree of pleiotropy. a Data from the dataset corresponding to Fig. 1 considering the average RR of genes (b = 0.032, R2 = 0.0009, F = 3.57, p = 0.06). b Data from Pickrell et al. (2016) considering the average RR of genomic regions (b = − 0.004, R2 = 0.0006, F = 0.19, p = 0.7). c Data from Watanabe et al. (2019) considering the average RR of genomic regions and the degree of pleiotropy of domains (b = 0.014, R2 = 0.010, F = 34.65, p = 4 × 10⁻⁹). d Data from Shikov et al. (2020) considering the average RR of genomic regions and the maximal degree of pleiotropy of domains (b = − 0.017, R2 = 0.01, F = 17.4, p = 3 × 10⁻⁵). Simple regression lines are shown

