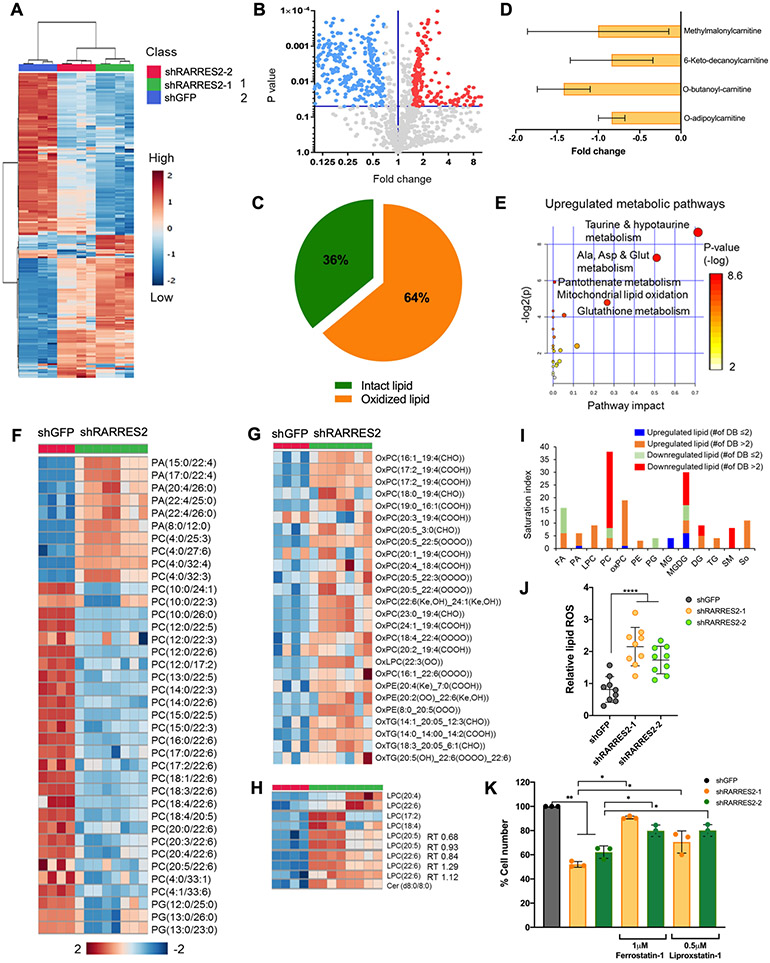
Figure 4. Chemerin-dependent lipid homeostasis pathways affects ferroptosis.
(A) Heatmap from untargeted lipidomics of 786-O infected with lentivirus targeting shGFP control, shRARRES2-1, and shRARRES2-2. Blue, low expression; red, high expression.
(B) Volcano plot showing the differentially expressed lipid metabolites in shGFP in comparison to shRARRES2. Blue and red circles represent lipid species that were significantly downregulated and upregulated, respectively, in RARRES2-targeted cells.
(C) Proportion of oxidized or breakdown versus intact lipid levels in shRARRES2 cells compared to shGFP.
(D) Fold change of acylcarnitine species in RARRES2-targeted 786-O cells versus shGFP.
(E) Metabolic Pathway Analysis using KEGG human metabolome database that shows the significantly upregulated metabolic pathways according to untargeted lipidomics and metabolomics data after chemerin knockdown.
(F) Heatmap from untargeted lipidomics of 786-O infected with lentivirus targeting shGFP (n=4) or shRARRES2 (including shRARRES2-1 and shRARRES2-2, n=8) showing lower glycerophospholipid species in chemerin deficient cells. Blue, low expression; red, high expression. PA, phosphatidic acid; PC, phosphatidylcholine; PG, phosphatidylglycerol.
(G) Heatmap from untargeted lipidomics showing higher oxidized glycerophospholipid species in chemerin deficient cells. Blue, low expression; red, high expression. OxPC, oxidized phosphatidylcholine; OxLPC, oxidized lysophosphatidylcholine; OxPE, oxidized phosphatidylethanolamine; OxTG, oxidized triacylglycerols.
(H) Heatmap from untargeted lipidomics showing higher lysophosphatidylcholine, the breakdown product of phosphatidylcholine, in chemerin deficient cells. Blue, low expression; red, high expression. LPC, lysophosphatidylcholine; Cer, ceramides.
(I) Saturation index of different lipid species after chemerin knockdown. Stacked bar chart shows different saturation abundances of significant lipid classes in chemerin knockdown cells compared to controls. DB, double bond.
(J) Lipid reactive oxygen species (ROS) measurement by BODIPY 581/591 C-11 in 786-O infected with lentivirus encoding either shGFP or shRARRES2. One-way ANOVA.
(K) 786-O cells infected with lentivirus encoding either shGFP or shRARRES2, were treated with 2 different ferroptosis inhibitors (1 μM Ferrostatin-1 or 0.5 μM Liproxstatin-1). Two-tailed student’s t-test.
Error bars represent SEM of three independent experiments and three technical replica per experiment. *p < 0.05; **p < 0.01; ***p < 0.001; **** p < 0.0001.

