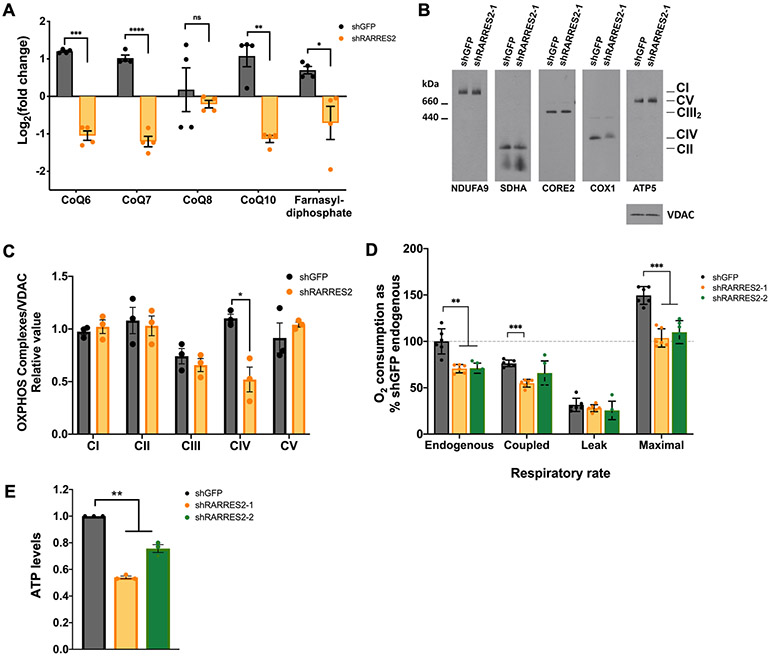
Figure 5. Genetic deletion of chemerin in ccRCC cells affects mitochondrial OXPHOS.
(A) Metabolic profiling of CoQ (CoQ6, CoQ7, CoQ8, and CoQ10) and farnesyl-diphosphate from mass spectrometry analysis of 786-O cells infected with lentivirus targeting shGFP control or shRARRES2. Four technical replicates were performed.
(B) Steady-state levels of mitochondrial individual OXPHOS complexes were evaluated by BN-PAGE analysis of whole cell extracts prepared in the presence of 1% lauryl maltoside (LM) and probed with antibodies against complex I subunit NDUFA9, complex II subunit SDHA, complex III subunit CORE2, complex IV subunit COX1 and complex V subunit ATP5.
(C) Signals from (B) were quantified and normalized by VDAC using the histogram function of Adobe Photoshop on digitalized images. Error bars represent the mean ± SD of three independent experiments with two technical replicates. Unpaired T-test with Welch’s correction.
(D) NADH substrate-driven cellular respiratory rates expressed as percentile of shGFP control endogenous O2 consumption. Error bars represent the mean ± SD of three independent experiments with two technical replicates. Unpaired t-test with Welch’s correction.
(E) ATP measurement following chemerin knockdown in 786-O cells. One-way ANOVA.
Error bars represent SEM of three independent experiments and three technical replica per experiment. *p < 0.05; **p < 0.01; ***p < 0.001; **** p < 0.0001; ns, not significant.

