Fig. 3.

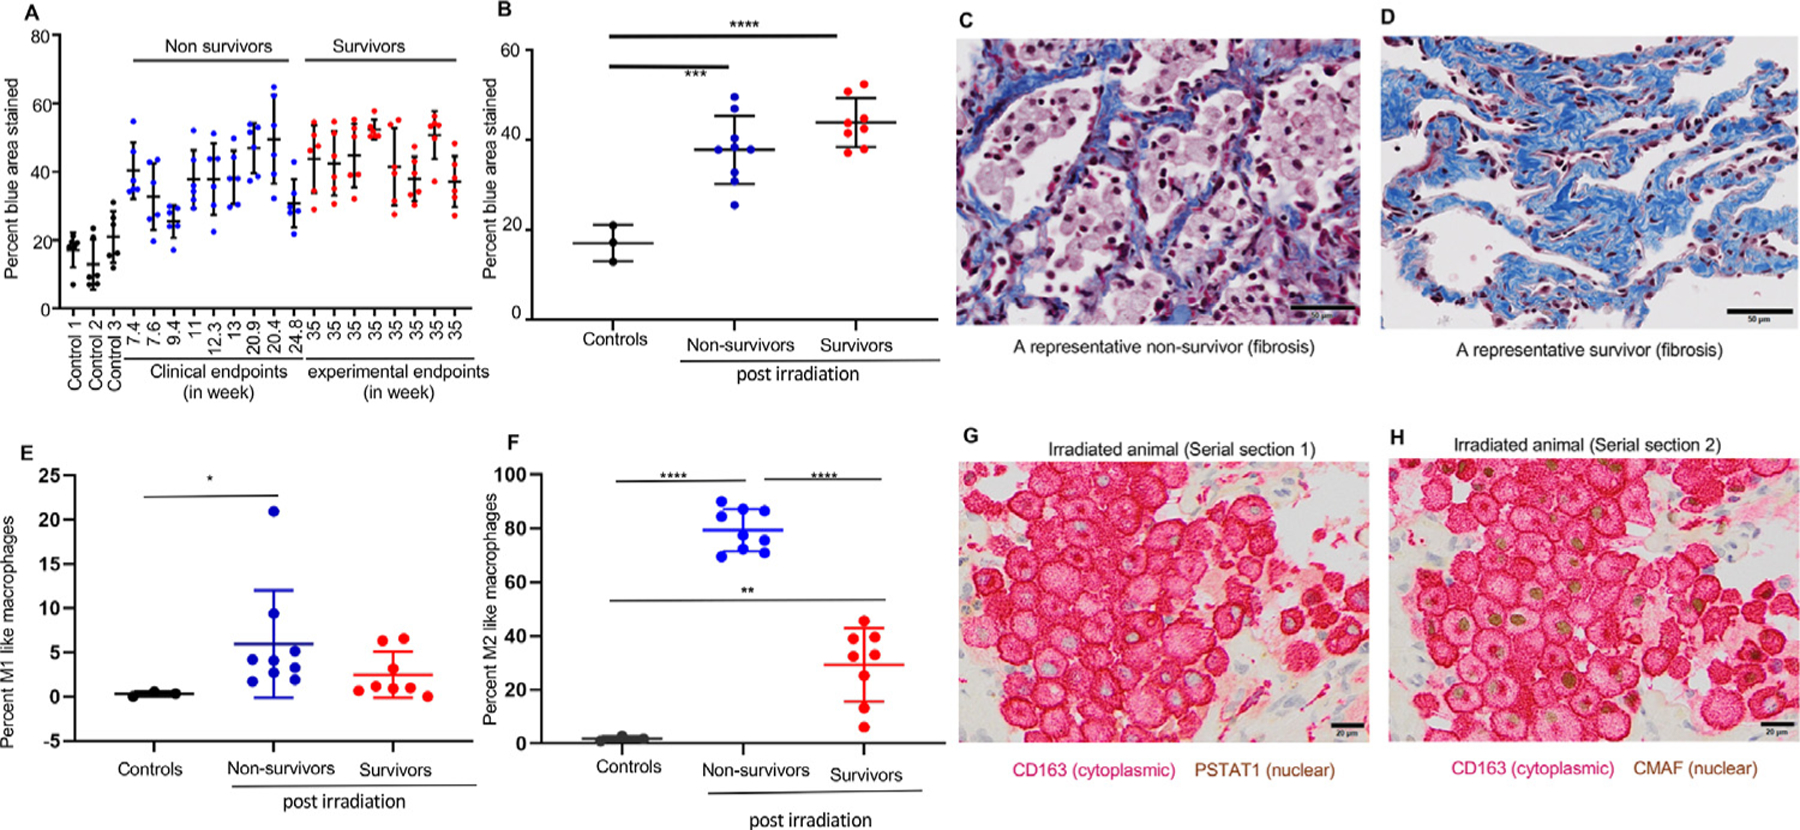
Quantitative assessment of the fibrosis and profibrotic macrophage (M2) phenotype in irradiated lungs. (A) Quantification of fibrosis as a percentage of area stained using Masson trichrome staining in individual controls (black bars), nonsurvivors (blue bars), and survivors (red bars). Six dots for each animal represent 6 different lung regions. (B) Average fibrotic area expressed as the mean ±SD between controls (n = 3), nonsurvivors (n = 9), and survivors (n = 9). Statistical significance was determined by 1-way analysis of variance with a Tukey multiple comparisons posttest. (C, D) Representative images of a postirradiation nonsurvivor and a survivor stained with Masson trichrome stain. Scale bars are 50 µm. (E, F) Quantification of M1-like (CD163 + PSTAT1) and M2-like (CD163 + CMAF) macrophages performed on serial lung sections of nonirradiated controls (n = 3) and irradiated monkeys (nonsurvivors, n = 9; survivors, n = 8) obtained at necropsy. Results for the percentage of M1 macrophages are expressed as medians ± interquartile ranges (IQRs); statistical significance was determined by the Mann-Whitney test. For M2, results are expressed as means ± SDs; statistical significance was determined by unpaired t tests. (G) Double immunostaining for macrophage marker CD163 (red) and M1-specific transcription factor PSTAT1 (brown) in a lung section 13 weeks after irradiation. (H) Double immunostaining for macrophage marker CD163 (red) and M2 specific transcription factor CMAF (brown) in a representative nonsurvivor postirradiated serial section of the same lung. For all data, *P < .05, **P < .01, and ***P < .001. Scale bars are 50 µm.
