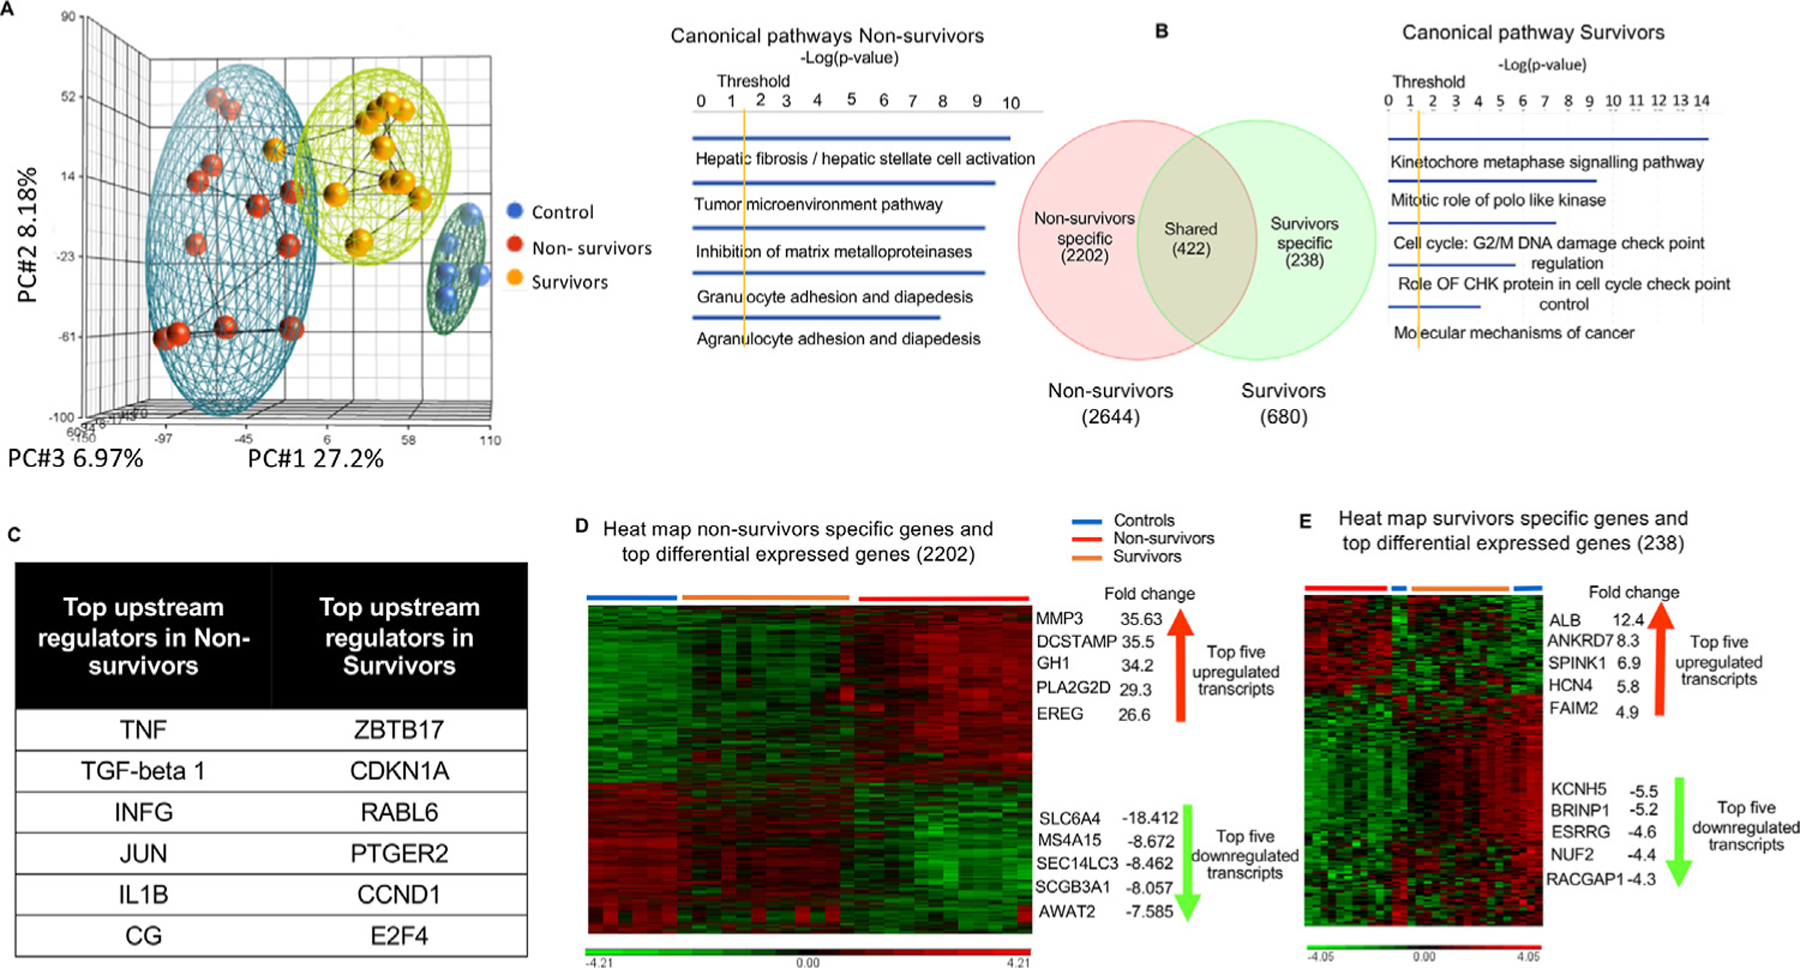
Fig. 4.

Specific lung transcriptomic analysis (RNA sequencing) in survivors and nonsurvivors. (A) Unsupervised principal component analysis of primate lung RNA sequencing data shows clear clustering into controls, nonsurvivors, and survivors (blue = controls, red = nonsurvivors, and yellow = survivors). (B) Venn diagram of differentially expressed transcripts by group comparisons. Values indicate the number of transcripts with significant differential expression (P < .05) across that contrast: nonsurvivors versus controls (2644); survivors versus controls (680); nonsurvivor-specific (2202), survivor-specific (238), and shared transcripts (422); along with canonical pathways elicited by nonsurvivor- and survivor-specific differentially expressed genes (DEGs) using ingenuity pathway analysis. (C) Upstream regulators (using Ingenuity Pathway Analysis) of nonsurvivor- and survivor-specific DEGs are illustrated by the Venn diagram. (D, E) Hierarchical clustering combined with a heat map of nonsurvivor- and survivor-specific DEGs shows clear differentiation between groups, listed with their top 5 upregulated and downregulated transcripts. Significant differentially expressed genes (DEGs) were conservatively defined as log2 fold change ratios ≥±1 and P values <.05 after adjustment for false discovery.
