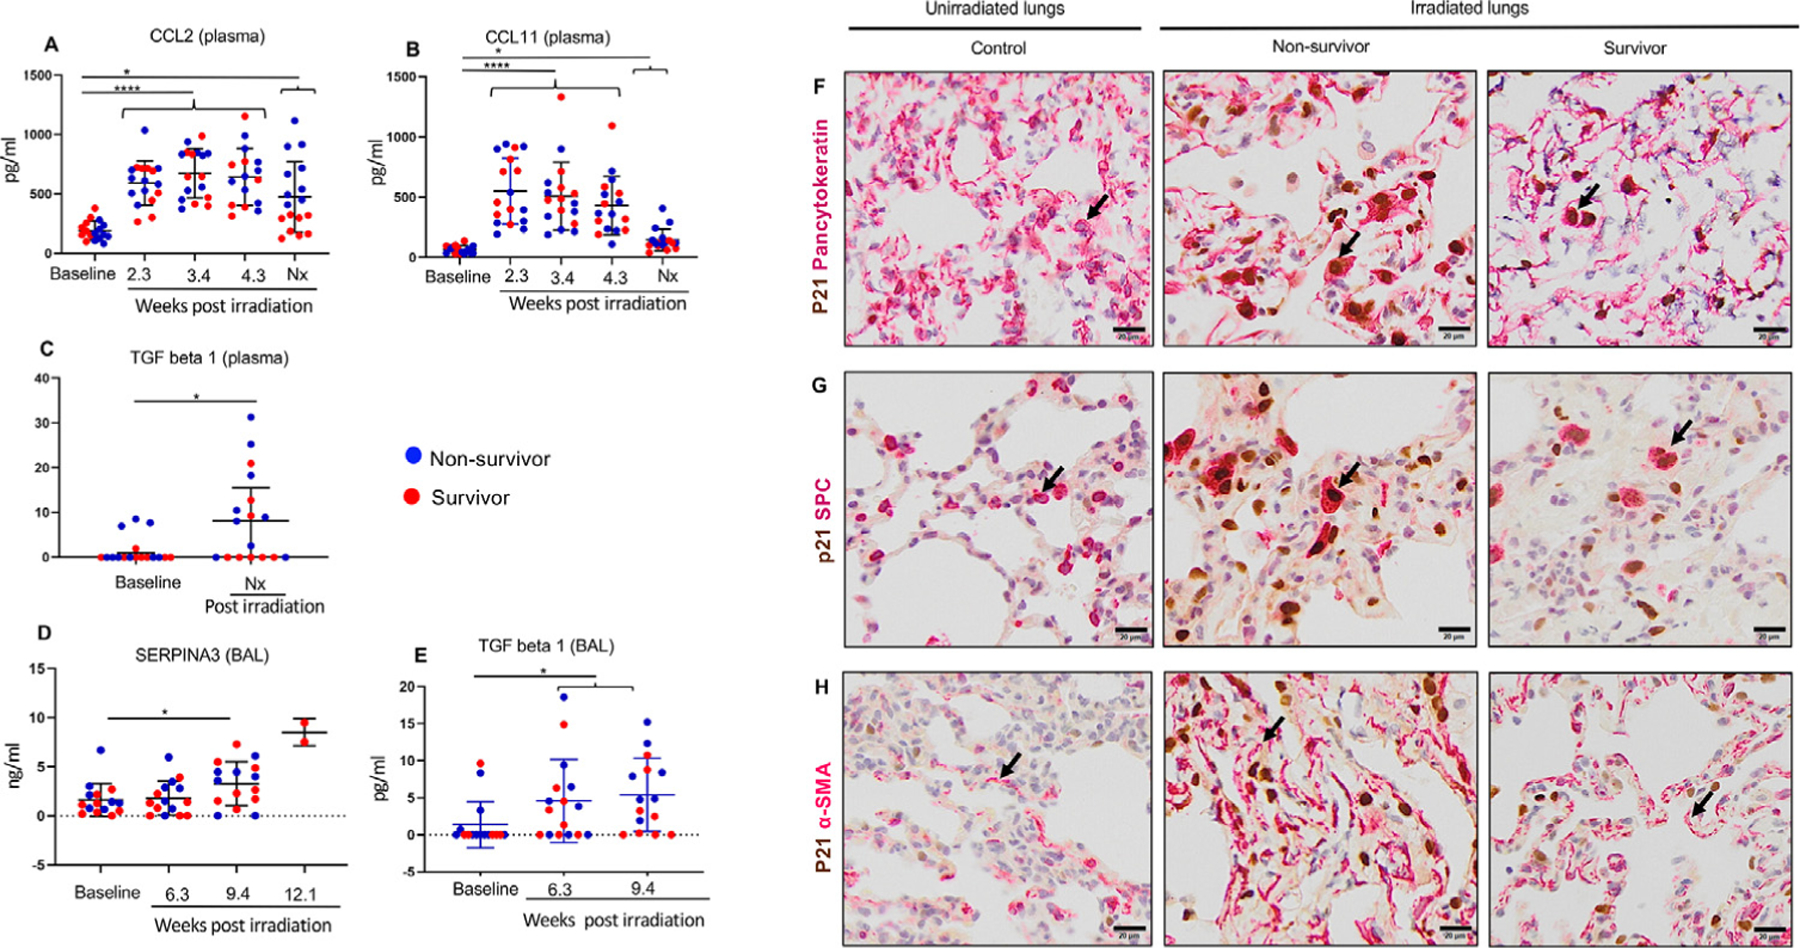
Fig. 6.

Protein expression of TGF-β1 and its associated transcripts. (A, B) Mean plasma values of CCL2 and CCL11 measured at 2.3 weeks (n = 17), 3.4 weeks (n = 17), 4.3 weeks (n = 16, n=17), and at necropsy (n = 17) after irradiation relative to baseline (n = 17). Results are expressed as means ± SDs, and statistical significance was determined by mixed-effects analysis, RM (repeated measures) 1-way analysis of variance, and Tukey multiple-comparison posttests. (C) TGF-β1 levels measured in plasma at necropsy (n = 17) relative to baseline (n = 17). Results are expressed as medians ± interquartile ranges (IQRs), and the Wilcoxon matched-pairs signed rank test was used for statistical significance. (D) Mean SERPINA3 levels detected via enzyme-linked immunosorbent assay in bronchoalveolar lavage (BAL) fluid (n = 15) collected at 3.6 weeks, 9.4 weeks, and 12.1 weeks (n = 2) after irradiation, relative to baseline. Results are expressed as means ± SDs, and statistical significance was determined by t tests. (E) TGF-β1 levels assessed on BAL fluid collected at 3.6 weeks (n = 16) and 9.4 weeks (n = 15) after irradiation, relative to baseline (n = 16). Results are expressed as medians ± IQRs, and the Wilcoxon matched-pairs signed rank test was used for statistical significance. (F) Upper panel, double staining (arrow) for epithelial marker, cyto-keratin (cytoplasmic), and cell cycle arrest marker p21 (nuclear). (G) Middle panel, double staining (arrow) for alveolar type II pneumocyte marker SPC (cytoplasmic) and p21 (nuclear). (H) Lower panel, smooth-muscle actin α-SMA (cytoplasmic, arrow) and p21 (nuclear) using representative lung sections of a control, nonsurvivor, and survivor. Scale bars are 50 µm.
