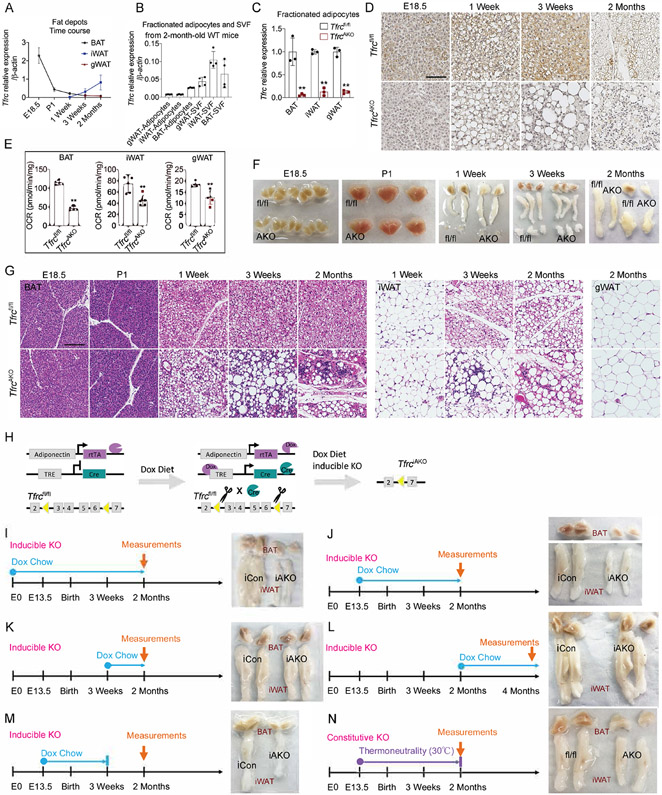
Figure 1. The Contribution of TFRC Mediated Iron Transport during Adipocytes Development and Maturation.
(A) mRNA levels of Tfrc in different fat pads of WT mice during development. n=5.
(B) mRNA levels of Tfrc in purified adipocytes fraction and SVF from fat pads of 2-month-old WT mice. n=4.
(C) Relative mRNA levels of Tfrc in purified adipocytes fraction from fat pads of 2-month-old Tfrcfl/fl and TfrcAKO mice. n=3.
(D) DAB iron staining of BAT harvested from Tfrcfl/fl and TfrcAKO mice at indicated age. Scale bar, 50 μM. Representative of 3 biological replicates.
(E) Basal OCR of diced fat pads of 2-month-old Tfrcfl/fl and TfrcAKO mice. n=5.
(F) Photograph of fat pads harvested from Tfrcfl/fl and TfrcAKO mice at indicated age. Representative of at least 5 biological replicates.
(G) H&E staining of fat pads harvested from Tfrcfl/fl and TfrcAKO mice at indicated age. Scale bar, 100 μM. Representative of 3 biological replicates.
(H) Overview of TfrciAKO mice model.
(I) Photograph of fat pads of 2-month-old iCon and TfrciAKO mice (Dox diet: E0-2 months). Representative of at least 5 biological replicates.
(J) Photograph of fat pads of 2-month-old iCon and TfrciAKO mice (Dox diet: E13.5-2 months). Representative of at least 5 biological replicates.
(K) Photograph of fat pads of 2-month-old iCon and TfrciAKO mice (Dox diet: 3 weeks-2 months). Representative of at least 5 biological replicates.
(L) Photograph of fat pads of 4-month-old iCon and TfrciAKO mice (Dox diet: 2 months-4 months). Representative of at least 5 biological replicates.
(M) Photograph of fat pads of 2-month-old iCon and TfrciAKO mice (Dox diet: E13.5-P21). Representative of at least 5 biological replicates.
(N) Photograph of fat pads of 2-month-old Tfrcfl/fl and TfrcAKO mice (TN: E13.5-2 months). Representative of at least 5 biological replicates.
Data are presented as mean ± SD. Two-tailed Student’s t-test. *P < 0.05, **P < 0.01. Results were confirmed in at least 2 independent experiments.

