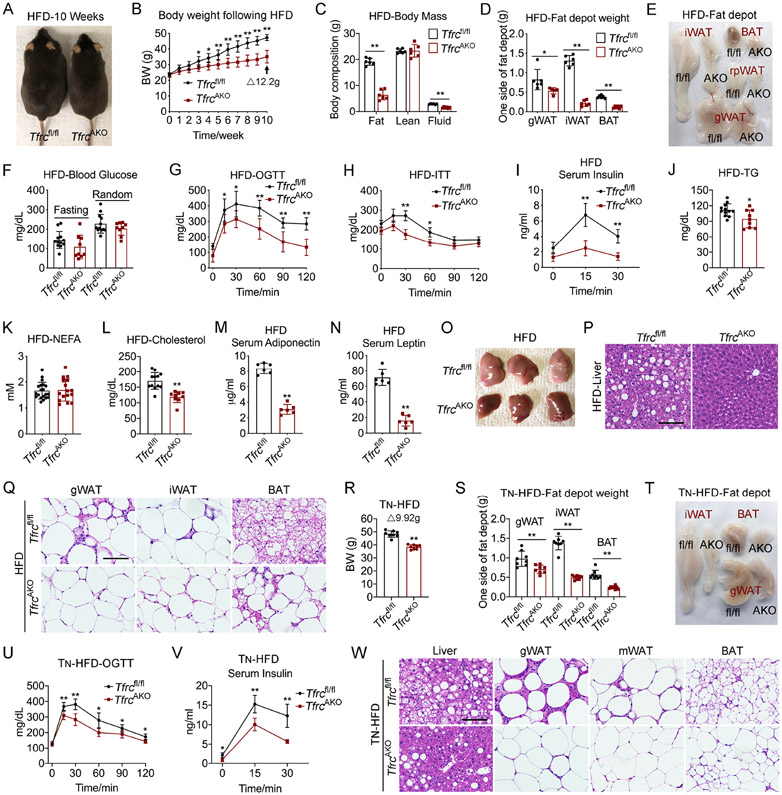
Figure 2. TfrcAKO Mice Displayed Improved Metabolic Phenotype under HFD Challenge at Both Room Temperature and TN Status.
(A) Representative photograph of Tfrcfl/fl and TfrcAKO mice after 10 weeks of HFD feeding. Representative of 5 biological replicates.
(B) Body weight of Tfrcfl/fl and TfrcAKO mice following HFD feeding. n=6.
(C-F) Body mass (C), fat pads weight (D), photograph of fat pads (E), and fasting and random blood glucose (F) of Tfrcfl/fl and TfrcAKO mice after 10 weeks of HFD feeding. n=6.
(G-I) Oral glucose tolerance test (OGTT) (G), insulin tolerance test (ITT) (H), and serum insulin levels during OGTT (I) of Tfrcfl/fl and TfrcAKO mice after 10 weeks of HFD feeding. n=6.
(J-N) Fasting serum triglycerides (J), NEFA (K), cholesterol (L), and random serum adiponectin (M) and leptin (N) levels of Tfrcfl/fl and TfrcAKO mice after 10 weeks of HFD feeding. n≥6.
(O-Q) Photograph of liver (O), H&E staining of liver (P), H&E staining of fat pads (Q) harvested from Tfrcfl/fl and TfrcAKO mice after 10 weeks of HFD feeding. Scale bar, 100 μM. Representative of 3 biological replicates.
(R-T) Tfrcfl/fl and TfrcAKO mice were exposed to TN (from E13.5, and thereafter), and fed on HFD from 2-month-old under TN. Body weight (R), weight of fat pads (S), and representative photograph of fat pads (T) of Tfrcfl/fl and TfrcAKO mice were presented after 10 weeks of HFD Feeding. n=8.
(U-V) OGTT (U) and serum insulin levels during glucose tolerance test (V) of Tfrcfl/fl and TfrcAKO mice described in R-T. n=8.
(W) H&E staining of liver and fat pads of Tfrcfl/fl and TfrcAKO mice described in R-T. Scale bar, 100 μM. Representative of 3 biological replicates.
Data are presented as mean ± SD. Two-way ANOVA with Dunnett’s test (B, G, H, I, U, V) or Two-tailed Student’s t-test (C, D, F, J-N, R, S). *P < 0.05, **P < 0.01. The weight of BAT includes the weight of BAT and the WAT connected to BAT. Results were confirmed in 3-5 independent experiments.

