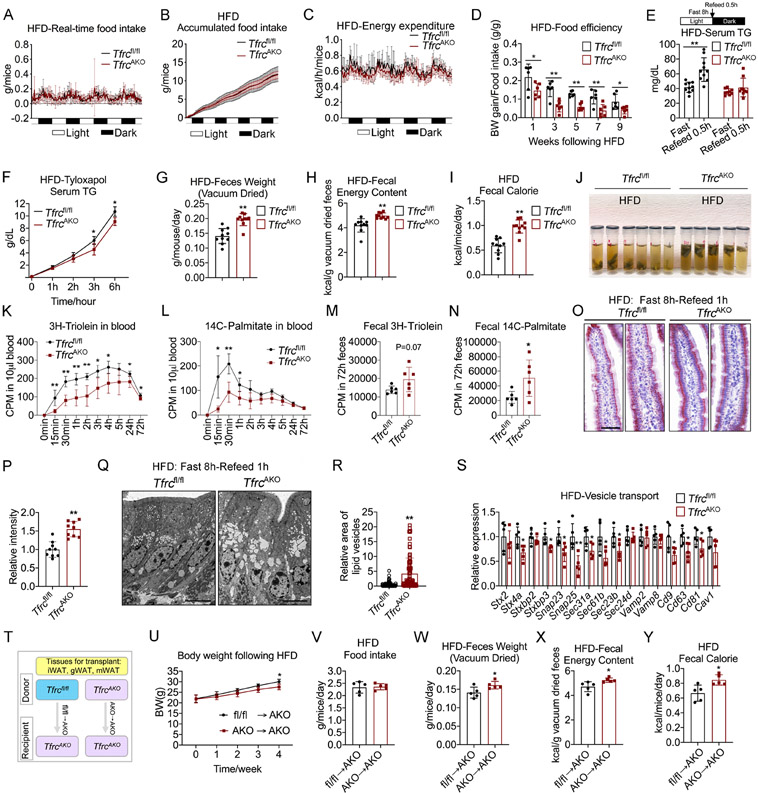
Figure 4. TfrcAKO Mice Show Less Intestinal Lipid Absorption compared to Tfrcfl/fl Mice.
(A-C) Realtime food intake (A), accumulated food intake (B) and energy expenditure (C) in 2-month-old Tfrcfl/fl and TfrcAKO mice following 9 weeks of HFD. n=6.
(D) Feed efficiency of Tfrcfl/fl and TfrcAKO mice during HFD feeding. n=6.
(E) Serum triglycerides levels of fasted Tfrcfl/fl and TfrcAKO mice (HFD 8 weeks) before and after refeed. n≥9.
(F) Post gavage (olive oil) serum triglycerides levels in HFD-fed Tfrcfl/fl and TfrcAKO mice pre-treated with tyloxapol. n=5.
(G-I) Daily feces weight (G), fecal energy content (H), and daily fecal calorie content (I) of Tfrcfl/fl and TfrcAKO mice after 8 weeks of HFD feeding. n≥9.
(J) Feces from HFD-fed Tfrcfl/fl and TfrcAKO mice were collected to tubes with DNA/RNA shield buffer and put at 4°C for 6 hours. Representative of 3 biological replicates.
(K-N) Radioactivity of 3H and 14C in blood and feces of HFD-fed Tfrcfl/fl and TfrcAKO mice following 3H-Triolein and 14C-Palmitate gavage. n=6.
(O-P) Oil-Red-O staining of villus of proximal small intestine of fasted Tfrcfl/fl and TfrcAKO mice (HFD 8 weeks) after 1 hour refeed (O). Scale bar, 50 μM. Quantification of the oil red signal in villus (P). Representative of 3 biological replicates.
(Q-R) Electron microscopy images for lipid droplets in enterocytes of proximal small intestine of fasted Tfrcfl/fl and TfrcAKO mice (HFD 8 weeks) after 1 hour refeed. (Q). Scale bar, 6 μM. Quantification of the vesicle area in villus (R). Representative of 3 biological replicates.
(S) Relative mRNA levels of vesicle transport related genes in small intestine of Tfrcfl/fl and TfrcAKO mice after 10 weeks of HFD feeding. n=5.
(T) Model for fat transplantation.
(U) Body weight of recipient mice (TfrcAKO) received fat from either Tfrcfl/fl or TfrcAKO mice following HFD feeding. n=5.
(V-Y) Daily food intake (V), feces weight (W), fecal energy content (X), and daily fecal calorie content (Y) of the recipient mice after 4 weeks of HFD feeding. n=5.
Data are presented as mean ± SD. Two-tailed Student’s t-test (D, E, G-I, M, N, P, R, S, V-Y) or Two-way ANOVA with Dunnett’s test (F, K, L, U). *P < 0.05, **P < 0.01. Results were confirmed in 2-4 independent experiments.

