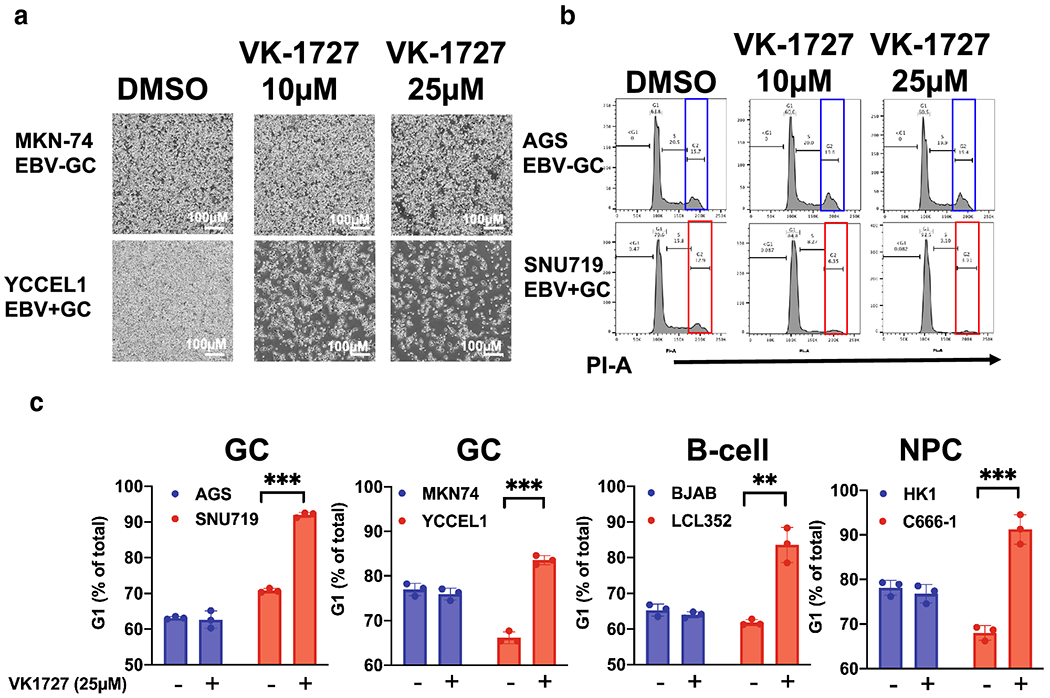
Figure 2: EBNA1 inhibitor VK-1727 inhibits cell cycle progression.

A. Images of EBV− (MKN74) and EBV+ (YCCEL1) GC cells with 4x objective using the Nikon TIE inverted microscope 72 hours after treatment with DMSO or VK-1727 (10 μM or 25 μM). Bar = 500 μm) B. Cell cycle profiles EBV− (AGS) and EBV+ (YCCEL1) cells treated with DMSO and 10 or 25 μM VK-1727 measured by FACS flow cytometry analysis of propidium iodide staining. Cell cycle changes, including a decrease in G2 (box) and an increase in G1, are observed in EBV-positive (SNU719), but not EBV-negative (AGS) gastric carcinoma cells. C. Cell cycle analysis of EBV-positive and EBV-negative GC, B-cells, and NPC cells treated with DMSO or VK-1727. G1 populations are represented as a percentage as total. (Student T test; ** p < 0.001, *** p < 0.0001). An increase in G1 as a percentage of the total population is increased in EBV-positive cells of B-cell, NPC, and GC origin (LCL, SNU719, YCCEL1, and C666-1), not in EBV-negative cells (Student T Test; ** p < 0.001).
