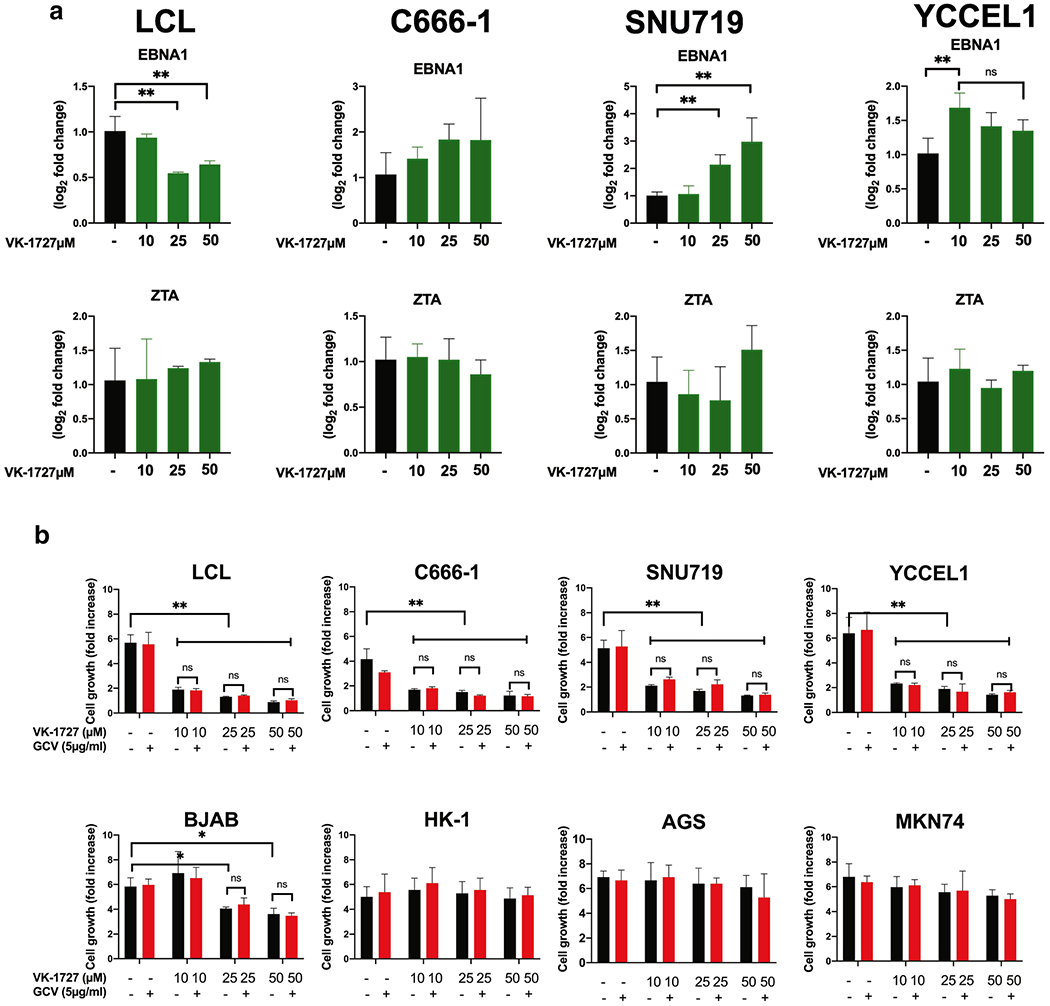
Figure 3. EBV gene expression patterns in vitro and inhibition of proliferation in EBV-positive cell lines.

A. Expression of EBV genes EBNA1 and ZTA in EBV-positive cell lines measured by ΔΔCT method (Student T Test; ** p < 0.001, *** p < 0.0001). B. Cell counts are plotted as fold increase in cell number after 72 hours treatment. Each bar represents mean fold increase +/− SD of 3 replicates (EBV-positive lines: SNU719, C666-1, YCCEL1, and LCL352; EBV-negative lines: AGS, HK-1, MKN74, and BJAB). Cells were treated with DMSO, VK-127 (at 10, 25, or 50 μM), and VK-1727 with GCV (5 μg/ml).
