
Figure 5. EBV gene expression and cell proliferation is decreased in EBV-positive GC treated in vivo.
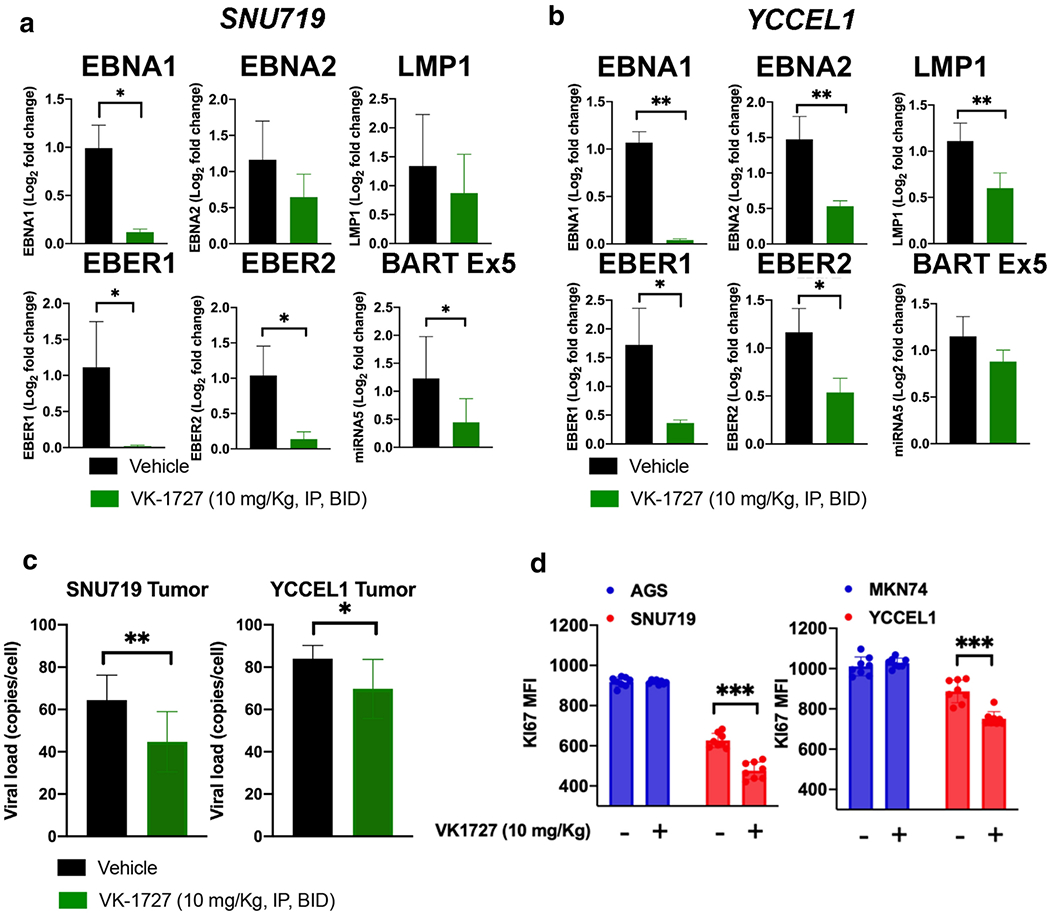
A. RT-PCR showing expression of EBNA1, EBNA2, LMP1, EBER1, EBER2, and BART Ex5 in SNU719 xenografts. B. RT-PCR showing expression of EBNA1, EBNA2, LMP1, EBER1, EBER2, and BART Ex5 in YCCEL1 xenografts. C. EBV viral loads in SNU719 and YCCEL1 tumor material from animals treated with VK-1727 or vehicle (Student T test; * p < 0.05, **p<0.01) D. Ki67 expression (mean fluorescence intensity as measured by flow cytometry).