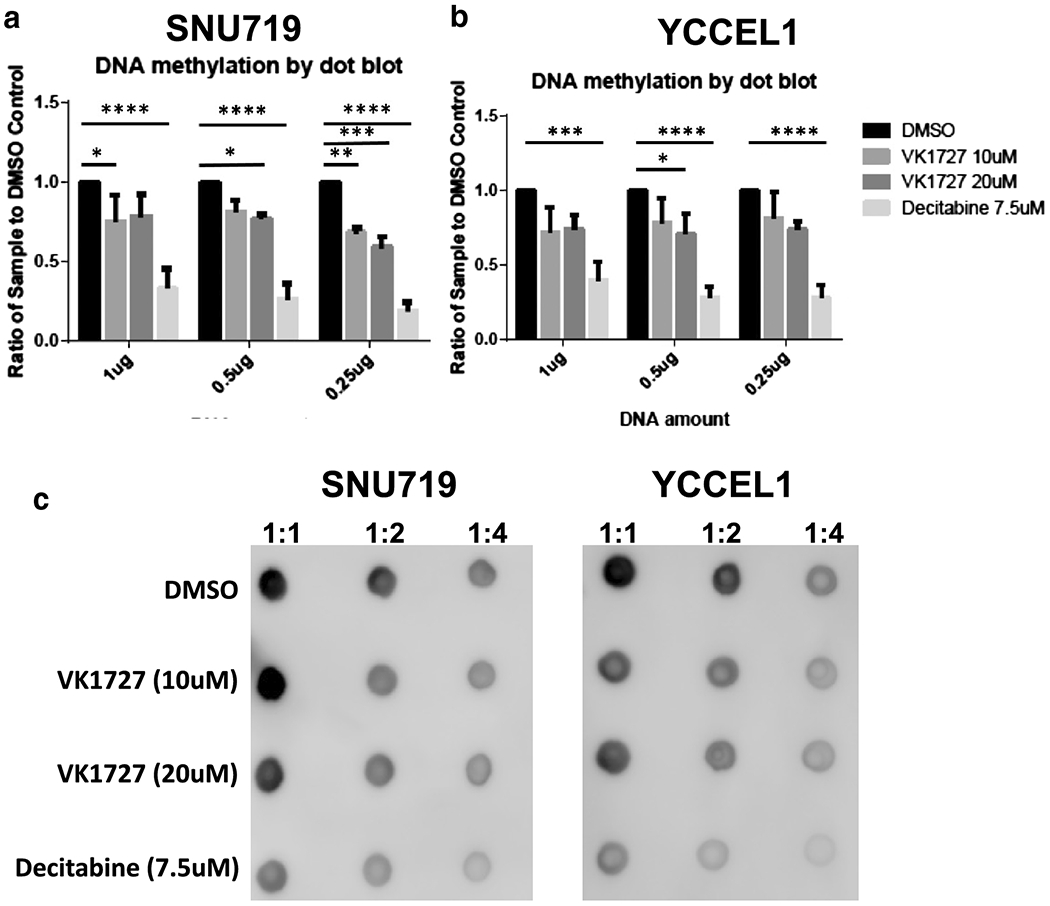
Figure 6. DNA demethylation in YCCEL1 and SNU719 cells treated with EBNA1 inhibitors.

A. Quantification of DNA methylation by dot blot in SNU719 represented as ratio compared to DMSO control. B. quantification of DNA methylation by dot blot in YCCEL1 represented as ratio compared to DMSO control (Dunnett’s test). C. Representative dot blots for SNU719 and YCCEL1.
