. 2021 Jun 15;81(15):3985–4000. doi: 10.1158/0008-5472.CAN-21-0953

Figure 5.

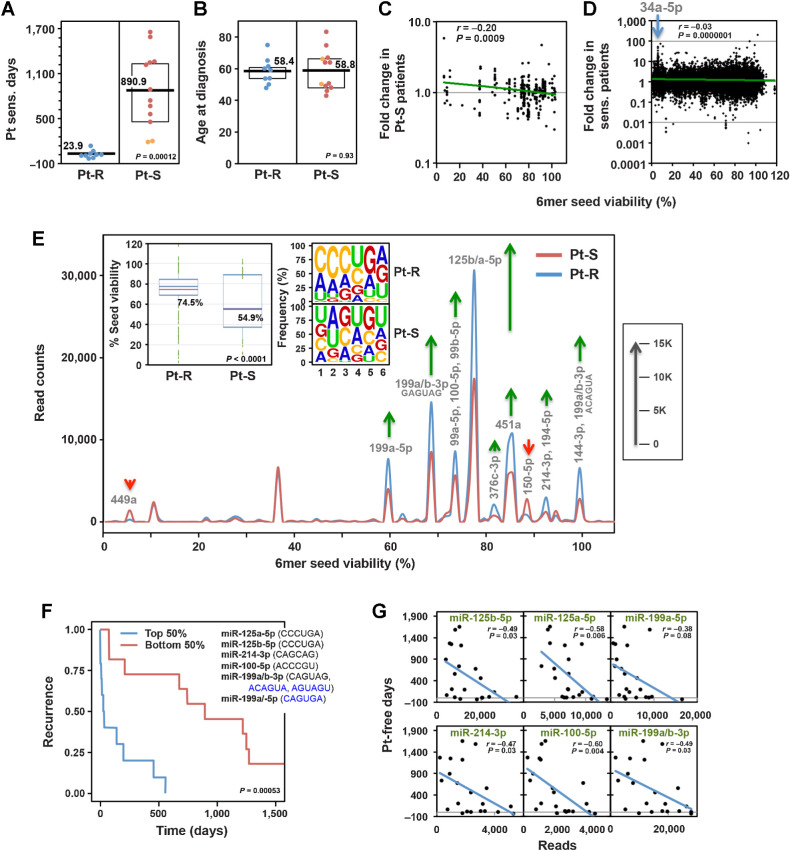
Figure 5. Lower seed tox of RISC-bound sRNAs in ovarian cancer tumors is associated with increased resistance to chemotherapy. A, Pt-sensitive days (days between the end of the last cycle of Pt-based chemotherapy and first relapse) in two groups of patients with ovarian cancer: Pt-R and Pt-S. Orange dots indicate two patients with intermediate (180 to 365 days since last treatment) Pt sensitivity. B, Differences in age at diagnosis between the two groups in Fig. 5A. Kruskal–Wallis median test P values are shown. C, Pearson correlation between the fold change in Pt-S versus Pt-R patients and the 6mer seed tox (% viability in HeyA8 cells). Shown are miRNAs with a sum of >10,000 across all samples (representing 85.4% of all reads). miRNA content of this pull down was 97.4% to 98.1%. D, Pearson correlation between the fold change in Pt-S versus Pt-R patients and the 6mer seed tox (% viability in HeyA8 cells). Shown are all approximately 38,000 different reads across all samples. The position of a number of reads representing miR-34a-5p highly enriched in the Pt-S cells is indicated. Note, these reads while highly upregulated, did not reach statistical significance in the fold-change analyses. E, Seed tox graph of RISC-bound miRNAs differentially expressed (P < 0.05, >1.5x fold change) in Pt-S versus Pt-R patients. Green arrows, net increase, and red arrows, net decrease of >1,000 reads in peak in Pt-R tumors, respectively. Insets, left, average seed tox of all sRNAs enriched in either Pt-R or Pt-S patients. Right, matching seed compositions. F, Kaplan–Meier analysis of patients with the top and bottom highest RISC content of the average of the six miRNAs shown (including their 6mer seeds). Noncanonical seeds are in blue. G, Regression analysis of the six miRNAs in D plotted against the number of Pt-S days.

Lower seed tox of RISC-bound sRNAs in ovarian cancer tumors is associated with increased resistance to chemotherapy. A, Pt-sensitive days (days between the end of the last cycle of Pt-based chemotherapy and first relapse) in two groups of patients with ovarian cancer: Pt-R and Pt-S. Orange dots indicate two patients with intermediate (180 to 365 days since last treatment) Pt sensitivity. B, Differences in age at diagnosis between the two groups in Fig. 5A. Kruskal–Wallis median test P values are shown. C, Pearson correlation between the fold change in Pt-S versus Pt-R patients and the 6mer seed tox (% viability in HeyA8 cells). Shown are miRNAs with a sum of >10,000 across all samples (representing 85.4% of all reads). miRNA content of this pull down was 97.4% to 98.1%. D, Pearson correlation between the fold change in Pt-S versus Pt-R patients and the 6mer seed tox (% viability in HeyA8 cells). Shown are all approximately 38,000 different reads across all samples. The position of a number of reads representing miR-34a-5p highly enriched in the Pt-S cells is indicated. Note, these reads while highly upregulated, did not reach statistical significance in the fold-change analyses. E, Seed tox graph of RISC-bound miRNAs differentially expressed (P < 0.05, >1.5x fold change) in Pt-S versus Pt-R patients. Green arrows, net increase, and red arrows, net decrease of >1,000 reads in peak in Pt-R tumors, respectively. Insets, left, average seed tox of all sRNAs enriched in either Pt-R or Pt-S patients. Right, matching seed compositions. F, Kaplan–Meier analysis of patients with the top and bottom highest RISC content of the average of the six miRNAs shown (including their 6mer seeds). Noncanonical seeds are in blue. G, Regression analysis of the six miRNAs in D plotted against the number of Pt-S days.