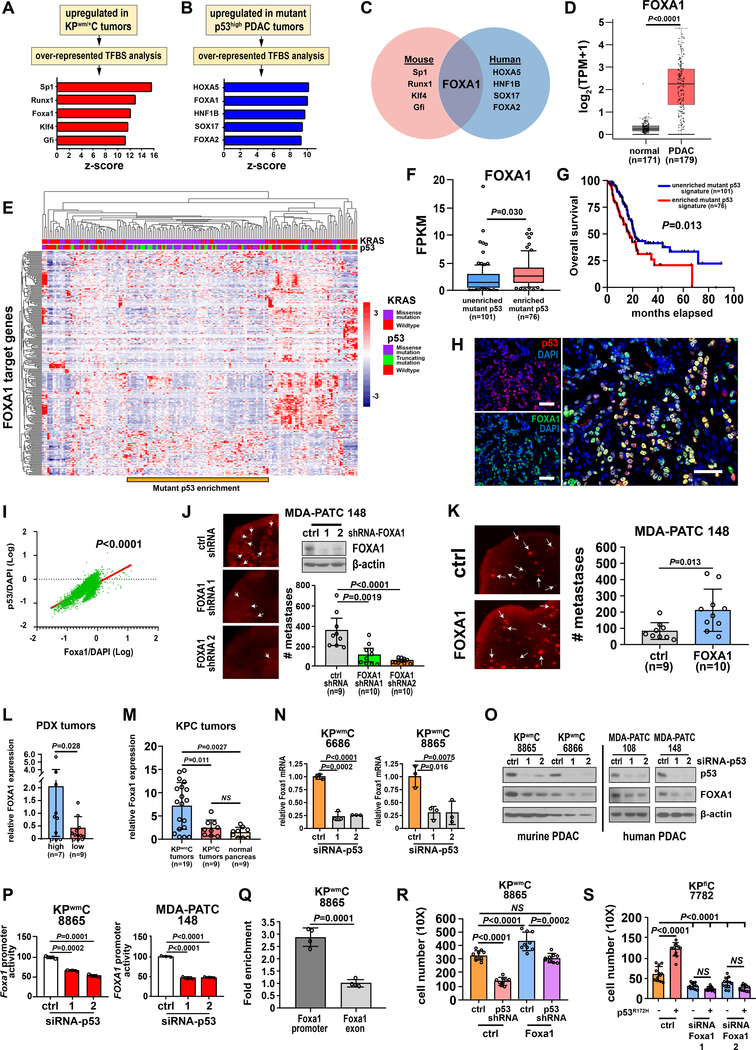
Figure 2. Mutant p53 is associated with a FOXA1 transcriptional signature and regulates FOXA1 to drive PDAC cell metastasis.
A, Overrepresented, conserved transcription factor binding site (TFBS) motifs in genes differentially upregulated in KPwm/+C (n=4) versus KPfl/+C (n=4) mice. B, Overrepresented, conserved TFBS motifs in genes differentially expressed in p53high (n=19) versus p53low (n=11) PDAC PDX tumors. C, Overlap of overrepresented TFBS motifs enriched in mutant p53 tumors in murine and human PDAC. D, Comparison of FOXA1 expression in normal pancreas and PDAC using the TCGA dataset. P value calculated by one-way ANOVA. E, Non-hierarchal clustering of genes upregulated in KPwm/+C tumors with FOXA1 binding motifs within the TCGA PDAC dataset. Relative to patients harboring truncating p53 mutations, patients with p53 missense mutations significantly clustered with oncogenic KRAS (Fisher exact test, p<0.0001). A distinct gene expression signature corresponds to this region as generated through listing FOXA1 target genes. F, Comparison of FOXA1 expression within and external to the region of mutant p53 enrichment. G, Overall survival of patients within and external to the region of mutant p53 enrichment that clusters with oncogenic KRAS. H, Representative spatial co-expression of mutant p53 and Foxa1 in KPwm/+C tumors as measured by confocal multicolor immunofluorescence (n=4 mice, 5 random fields/mouse). Scale bars, 50μM. I, Correlation of mutant p53 and Foxa1 expression as measured by Pearson correlation (p<0.0001). J, FOXA1 was knocked down in PDAC cells and metastasis measured by lung colonization metastasis assays. K, FOXA1 was overexpressed in PDAC cells and metastasis measured by lung colonization metastasis assays. L, Comparison of FOXA1 expression between p53high and p53low PDX models. M, Comparison of Foxa1 expression between tumors derived from KPwm/+C or KPfl/+C mice and normal murine pancreas. N and O, FOXA1 mRNA and protein levels after mutant p53 was silenced in murine and human PDAC. P, FOXA1 promoter reporter activity after mutant p53 knockdown. Q, Enrichment of mutant p53 occupancy at the Foxa1 promoter relative to a downstream exon. Pooled data from four independent experiments. R, Effect of Foxa1 overexpression on PDAC cell migration/invasion with and without mutant p53 knockdown. S, Effect of ectopic mutant p53 overexpression on PDAC cell migration/invasion with and without Foxa1 knockdown. (J, K, L, M, N, P, Q), Data are mean±s.d. and P values determined by unpaired two-tailed t-tests. (N, O, P), Data representative of at least three independent experiments, each in triplicate. (R, S), P value calculated by one-way ANOVA.

